US Dollar Index pops after US GDP reading reveals inflationary forces still at work
- The US Dollar books broad gains after the second reading of the US GDP release.
- Traders see the inflation component pick up and catch markets by surprise.
- The US Dollar Index (DXY) breaks above 107.00 and stretches higher.
The US Dollar Index (DXY), which tracks the performance of the US Dollar (USD) against six major currencies, is breaking above 107.00 for the first time in five trading days, after some important US data releases which are putting inflation concerns back on the map. The DXY initially this Thursday was receiving a bit of a tailwind from the Gold and US yields sell-off. The move came after United States (US) President Donald Trump spoke about tariffs during his first real cabinet meeting on Wednesday, leaving reports puzzled on what levies would be imposed to which countries and the timing.
The US President added that Europe must brace as well for a 25% tariff on autos and other things, but he did not specify when these levies would come into effect. Trump lashed out at the bloc saying it was created only “to screw the United States”.
In the meantime, the second US Gross Domestic Product reading (GDP) for the fourth quarter has turn that mild tailwind into a big one. The headline GDP reading came in higher, which as a surprise, while the inflation elements were turning hot as well. This just one day ahead of the Federal Reserve's (Fed) preferred inflation gauge, the Personal Consumption Expenditures reading (PCE), inflation is back on the agenda.
Daily digest market movers: PCE Friday more important than ever
- Overnight, several US officials had to issue additional statements on the current timetable for US tariffs being imposed after the US President contradicted himself multiple times on what kind of tariffs would take place, when and for which countries. The troubled communication from Trump himself cast a fog over the tariff element, triggering a steep selloff in Gold (which was the tariff safe haven until now), Bloomberg reports.
- The main data elements for this Thursday have been released:
- The second reading of the US Gross Domestic Product (GDP) for the fourth quarter of 2024:
- The GDP annualized came in as expected at 2.3%.
- The headline preliminary Personal Consumption Expenditures (PCE) component came in higher at 2.4%, beating the 2.3% with the core number turning red hot at 2.7%, surpassing the 2.5%.
- US Initial Jobless Claims for the week ending on February 21 cme in higher at 224,000 with specific numbers for Washington D.C. on the uprising. Clearly the DOGE effect is playing out here. The US Continuing Claims for the week ending on February 14 fell to 1.862 million, below the expected 1.870 million people and below the previous 1.869 million people.
- The second reading of the US Gross Domestic Product (GDP) for the fourth quarter of 2024:
- At 16:00 GMT, the US Kansas Fed Manufacturing Activity Index for February will be released. No forecast is available with the previous reading at -5.
- Five US Federal Reserve (Fed) officials are set to speak:
- At 15:00 GMT, Federal Reserve Vice Chair for Supervision Michael Barr delivers a speech on "Novel Activity Supervision" at the Bank and Fintech Arrangements TechSprint event in Washington, D.C.
- At 16:45 GMT, Federal Reserve Governor Michelle Bowman gives a speech focusing on Community Banking at the Fort Hays State University Robbins Banking Institute Lecture Series in Hays, Kansas.
- At 18:00 GMT, Federal Reserve Bank of Richmond President Thomas Barkin will speak about "Inflation then and now", in Fayetteville Cumberland Economic Development, North Carolina.
- Just 15 minutes later, at 18:15 GMT, Federal Reserve Bank of Cleveland President and Chief Executive Officer Beth M. Hammack participates in the “2025 Bank Regulation Research Conference” at the Columbia University/Bank Policy Institute, New York.
- Rounding up at 20:15 GMT Federal Reserve Bank of Philadelphia President Patrick T. Harker will discuss the economic outlook at the Lyons Economic Forecast, presented by the University of Delaware's Center for Economic Education and Entrepreneurship, in Newark, Delaware.
- Equities are rolling over in both Europe and the US with the US indices down less than 1% while Europe faces bigger losses near its closing bell.
- The CME Fedwatch Tool projects a 33.0% chance that the interest rates will remain at the current range in June, with the rest showing a possible rate cut.
- The US 10-year yield trades around 4.28%, not far from its low for this week aat 4.24%, nd again further down from last week’s high at 4.574%.
US Dollar Index Technical Analysis: There it is, finally
The US Dollar Index (DXY) is not really thriving after President Trump’s overnight comments on tariffs. Again, it looks like the US Dollar cannot enjoy a very light part of the current market flow, offset largely by the continuous drop in US yields. Look out for inflation-sensitive data that might counter the current Federal Reserve’s rate cut expectations, pushing US yields back higher and triggering a stronger Greenback.
On the upside, the 100-day Simple Moving Average (SMA) could limit bulls buying the Greenback near 106.75. From there, the next leg could go up to 107.35, a pivotal support from December 2024 and January 2025. In case US yields recover and head higher again, even 107.95 (55-day SMA) could be tested.
On the downside, if the DXY fails to hold above the 106.52 level, another leg lower might be needed to entice Dollar bulls to reenter near 105.89 or even 105.33.
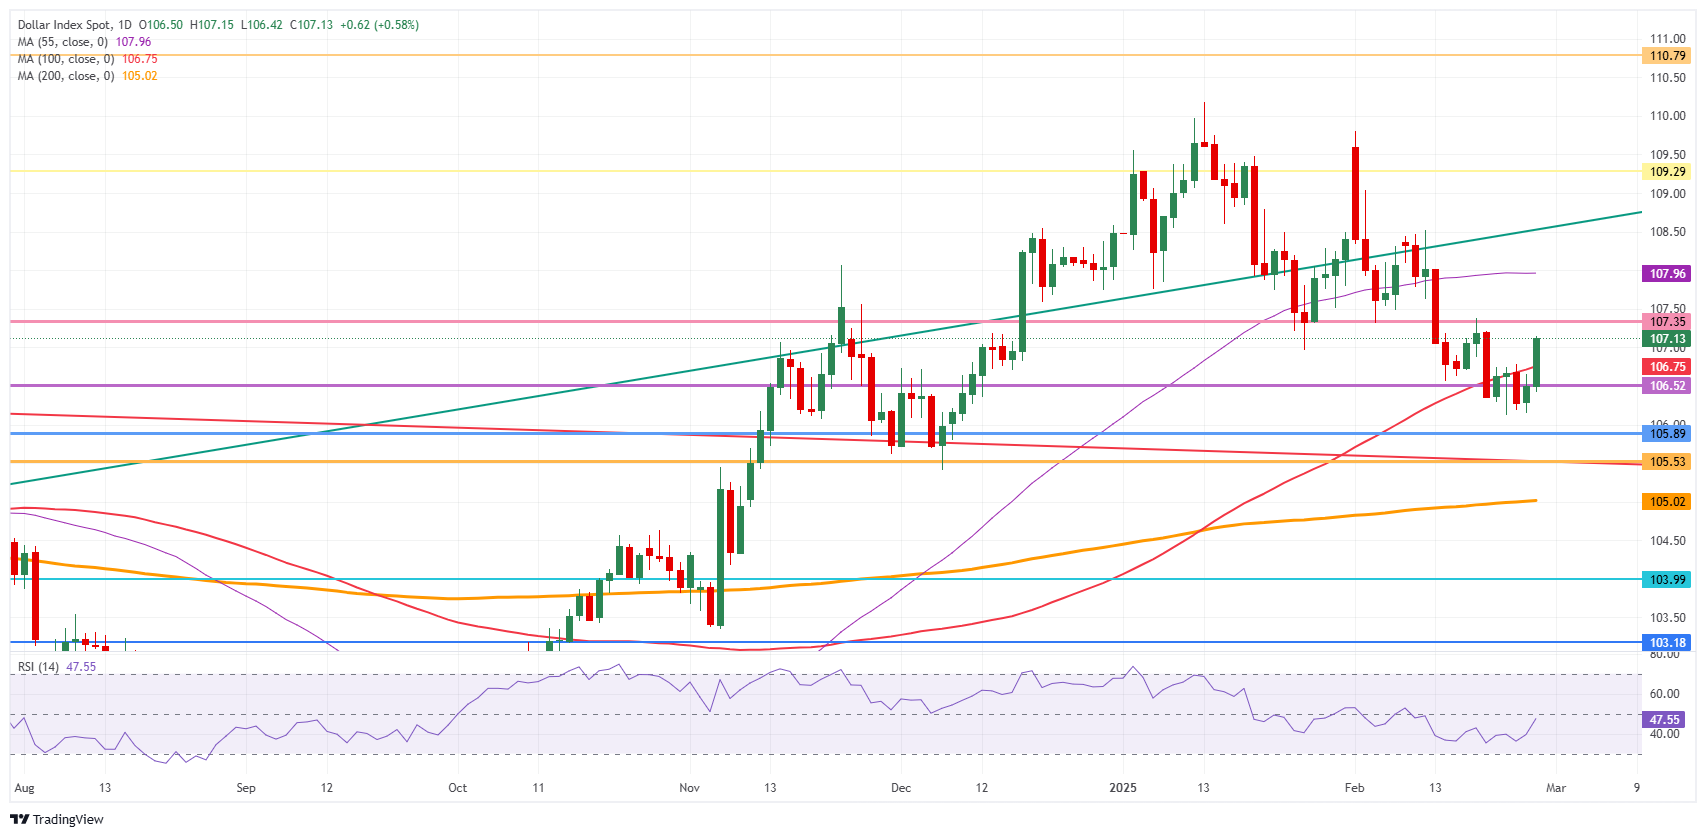
US Dollar Index: Daily Chart
GDP FAQs
A country’s Gross Domestic Product (GDP) measures the rate of growth of its economy over a given period of time, usually a quarter. The most reliable figures are those that compare GDP to the previous quarter e.g Q2 of 2023 vs Q1 of 2023, or to the same period in the previous year, e.g Q2 of 2023 vs Q2 of 2022. Annualized quarterly GDP figures extrapolate the growth rate of the quarter as if it were constant for the rest of the year. These can be misleading, however, if temporary shocks impact growth in one quarter but are unlikely to last all year – such as happened in the first quarter of 2020 at the outbreak of the covid pandemic, when growth plummeted.
A higher GDP result is generally positive for a nation’s currency as it reflects a growing economy, which is more likely to produce goods and services that can be exported, as well as attracting higher foreign investment. By the same token, when GDP falls it is usually negative for the currency. When an economy grows people tend to spend more, which leads to inflation. The country’s central bank then has to put up interest rates to combat the inflation with the side effect of attracting more capital inflows from global investors, thus helping the local currency appreciate.
When an economy grows and GDP is rising, people tend to spend more which leads to inflation. The country’s central bank then has to put up interest rates to combat the inflation. Higher interest rates are negative for Gold because they increase the opportunity-cost of holding Gold versus placing the money in a cash deposit account. Therefore, a higher GDP growth rate is usually a bearish factor for Gold price.
Forex News
Keep up with the financial markets, know what's happening and what is affecting the markets with our latest market updates. Analyze market movers, trends and build your trading strategies accordingly.