
Gold price struggles to capitalize on intraday recovery from multi-week low; remains below $3,050
- Gold price reverses an Asian session slide to over a three-week low, though it lacks follow-through.
- Recession fears continue to weigh on investor sentiment and benefit the safe-haven commodity.
- Bets for more aggressive Fed rate cuts undermine USD and also lend support to the XAU/USD pair.
Gold price (XAU/USD) attracts some buyers near the $2,972-2,971 area, or a nearly four-week low touched earlier this Monday, and for now, seems to have stalled its retracement slide from the all-time peak touched last week. A broader meltdown across the global financial markets, triggered by US President Donald Trump's sweeping reciprocal tariffs announced last week, offers some support to the safe-haven commodity. Adding to this, data published earlier today showed that the People’s Bank of China (PBOC) increased its state Gold reserves for the fifth straight month, which further acts as a tailwind for the commodity.
The anti-risk flow, along with expectations that a tariffs-driven US economic slowdown might force the Federal Reserve (Fed) to resume its rate-cutting cycle soon, leads to a further steep decline in the US Treasury bond yields. This, in turn, fails to assist the US Dollar (USD) to build on Friday's move higher from a multi-month low. This, along with persistent geopolitical risks, turns out to be another factor benefiting the non-yielding Gold price. Traders, however, continue to liquidate their long positions and raise cash to cover losses elsewhere, which, in turn, caps the upside for the precious metal and warrants some caution.
Daily Digest Market Movers: Gold price bulls remain on the sidelines despite risk-off mood; weaker USD
- The widening global trade war continues to fuel concerns about a global economic recession and leads to an extended sell-off in equity markets across the world. This, in turn, prompted traders to liquidate their long positions around the Gold price and raise cash to cover losses elsewhere.
- According to data released this Monday, the People’s Bank of China (PBOC) added gold to its reserves for a fifth consecutive month in March. In fact, the People's Bank of China's holding rose by 0.09 million troy ounces last month amid rising global trade and geopolitical turmoil.
- US President Donald Trump imposed reciprocal tariffs of at least 10% on all imported goods late last Wednesday, with China facing 54% levies under this new regime. In response, China’s Commerce Ministry announced on Friday that they will levy additional tariffs of 34% on all US imports.
- Meanwhile, US Commerce Secretary Howard Lutnick confirmed on Sunday that the tariffs would not be postponed and the policy would remain in place for days and weeks. Adding to this, Trump stated that there would be no deal with China unless the trade deficit is solved.
- The US Dollar struggles to capitalize on Friday's modest recovery move from a multi-month low that followed the release of the better-than-expected US Nonfarm Payrolls (NFP) report. In fact, the closely-watched jobs data showed that the economy added 228K jobs in March vs. 117K previous.
- Meanwhile, Federal Reserve (Fed) Chair Jerome Powell said that that inflation is closer to target but still slightly elevated. Powell added that Trump's tariffs could have a strong inflationary impact and that the Fed's job is to avoid temporary price hikes turning into persistent inflation.
- Investors, however, are still pricing in the possibility that the US central bank will resume its rate-cutting cycle in June and also lower borrowing costs at least four times this year. This, along with the anti-risk low, keeps the yield on the benchmark 10-year US government bond below the 4.0% mark.
- This, in turn, holds back the USD bulls from placing aggressive bets and assists the non-yielding yellow metal to stage a modest intraday bounce from a nearly four-week low touched during the Asian session on Monday. The lack of follow-through, however, warrants caution for bulls.
Gold price seems vulnerable to prolong the corrective slide; $3,055 support-turned-resistance holds the key
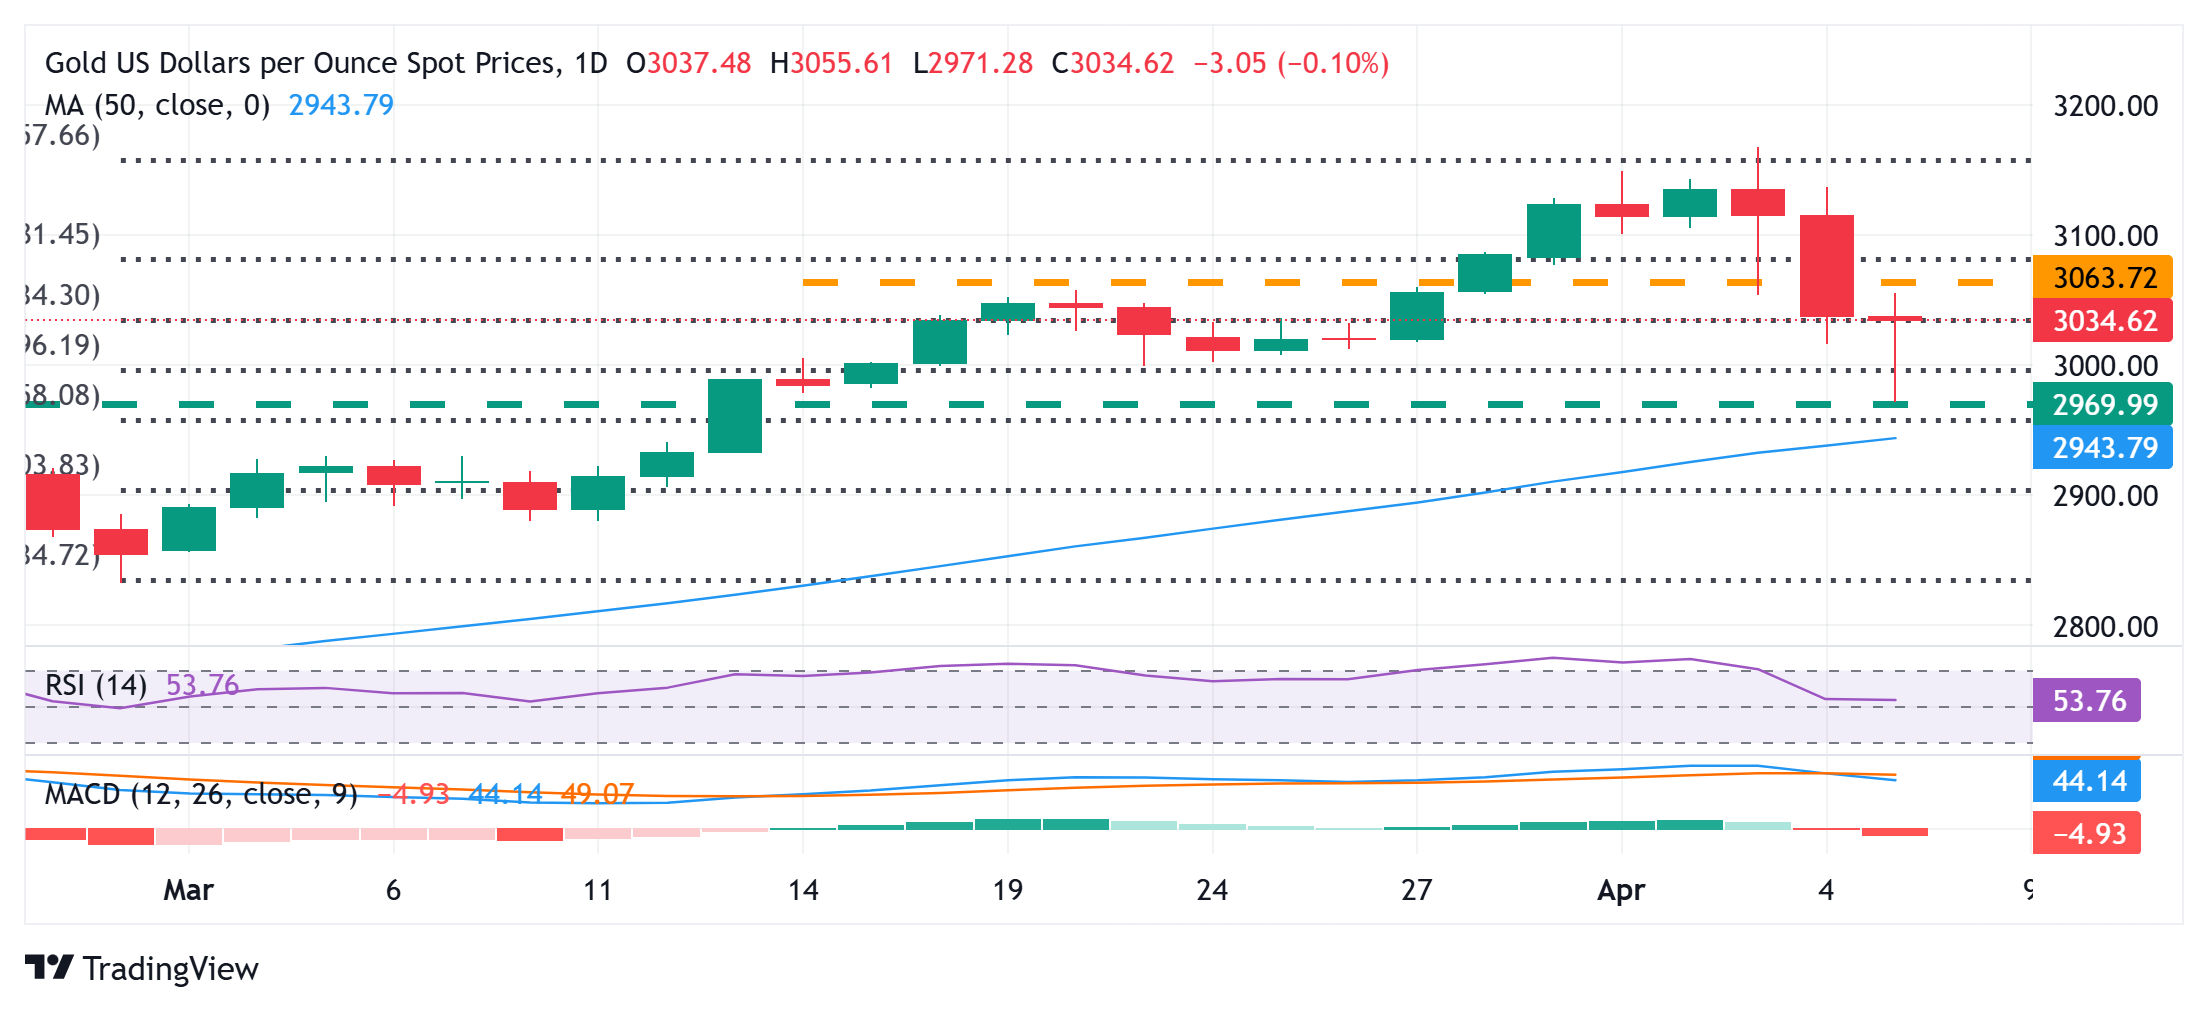
From a technical perspective, last week's sharp retracement slide from the all-time peak stalls ahead of the 61.8% Fibonacci retracement level of the February-April strong move up. The subsequent move up, however, falters near the $3,055 horizontal support breakpoint, now turned resistance. The latter should now act as a key pivotal point for intraday traders, above which the Gold price could climb to the $3,080 region en route to the $3,100 round figure.
On the flip side, the $3,000 psychological mark, which coincides with the 50% retracement level, now seems to protect the immediate downside ahead of the $2,972-2,971 area, or the multi-week low touched earlier this Monday. This is closely followed by the 50-day Simple Moving Average (SMA), around the $2,946 area, which if broken decisively might shift the near-term bias in favor of bearish traders and pave the way for a further depreciating move.
US Dollar PRICE Today
The table below shows the percentage change of US Dollar (USD) against listed major currencies today. US Dollar was the strongest against the Australian Dollar.
| USD | EUR | GBP | JPY | CAD | AUD | NZD | CHF | |
|---|---|---|---|---|---|---|---|---|
| USD | -0.27% | 0.13% | 0.45% | -0.06% | 0.65% | 0.27% | -0.44% | |
| EUR | 0.27% | 0.69% | 1.35% | 0.84% | 0.85% | 1.17% | 0.41% | |
| GBP | -0.13% | -0.69% | -0.62% | 0.14% | 0.15% | 0.48% | -0.24% | |
| JPY | -0.45% | -1.35% | 0.62% | -0.48% | 1.15% | 1.06% | -0.54% | |
| CAD | 0.06% | -0.84% | -0.14% | 0.48% | 0.36% | 0.33% | -0.66% | |
| AUD | -0.65% | -0.85% | -0.15% | -1.15% | -0.36% | 0.33% | -0.46% | |
| NZD | -0.27% | -1.17% | -0.48% | -1.06% | -0.33% | -0.33% | -0.72% | |
| CHF | 0.44% | -0.41% | 0.24% | 0.54% | 0.66% | 0.46% | 0.72% |
The heat map shows percentage changes of major currencies against each other. The base currency is picked from the left column, while the quote currency is picked from the top row. For example, if you pick the US Dollar from the left column and move along the horizontal line to the Japanese Yen, the percentage change displayed in the box will represent USD (base)/JPY (quote).
Forex News
Keep up with the financial markets, know what's happening and what is affecting the markets with our latest market updates. Analyze market movers, trends and build your trading strategies accordingly.