
Silver Price Analysis: Silver price could be forming a Bear Flag price pattern
- Silver price may have formed a Bear Flag pattern on the 4-hour chart.
- The pattern suggests a continuation of the bearish trend to targets substantially lower.
- Support from a relic of long-term support and resistance at $25.80 is likely to provide a floor for any sell-off.
Silver (XAG/USD) price may have formed a Bear Flag pattern on the 4-hour chart which bodes ill for the precious metal’s price going forward.
4-hour Chart
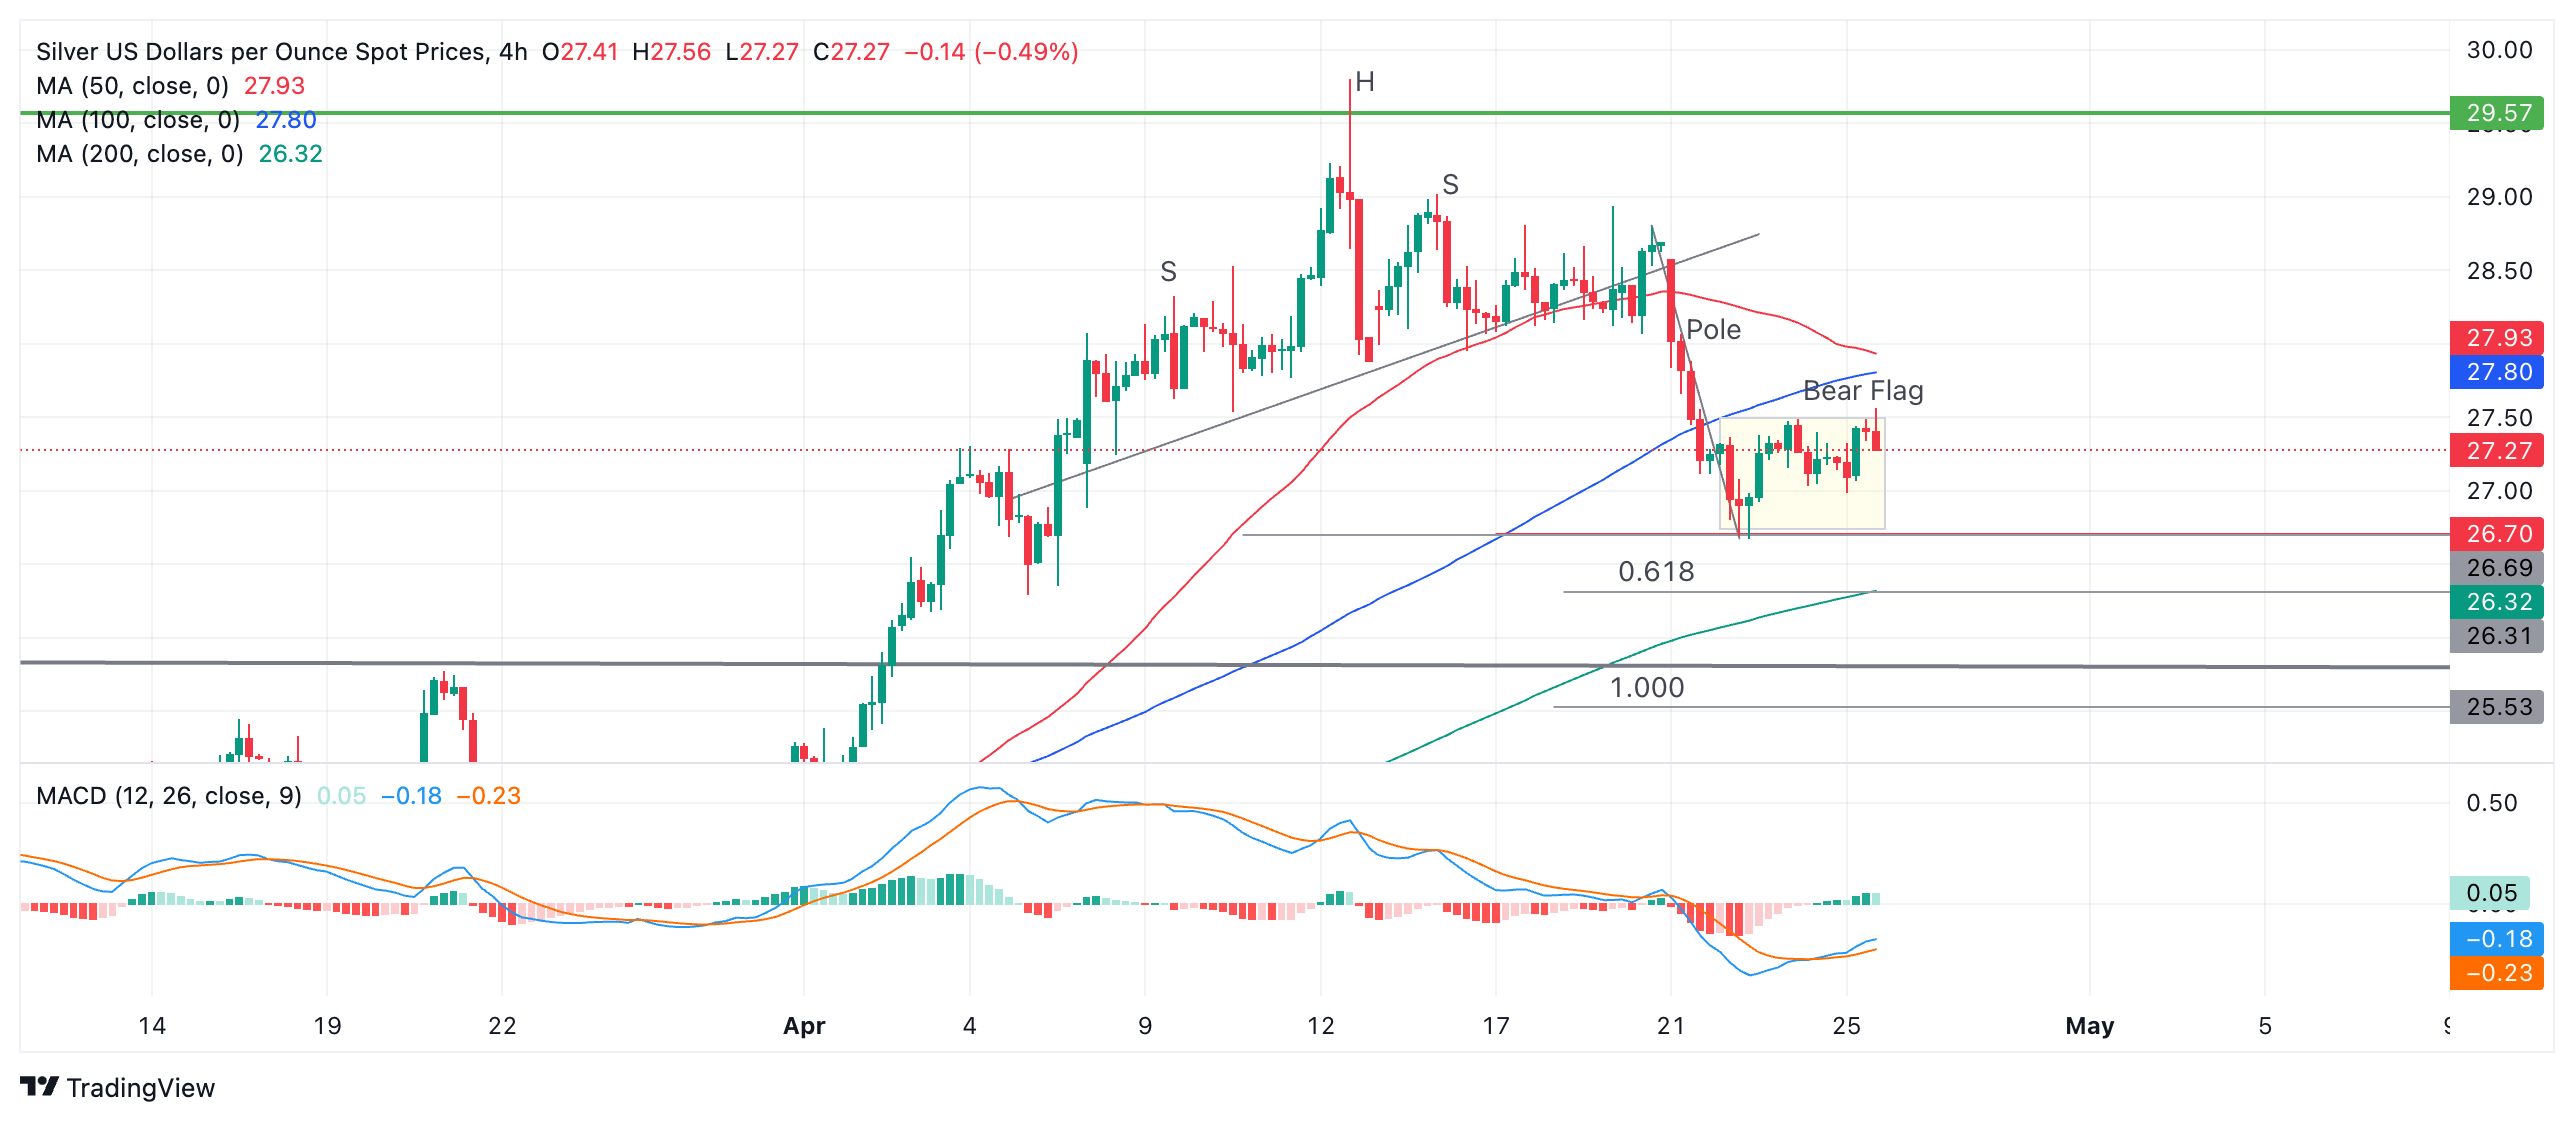
After forming a multiple shouldered Head and Shoulders (H&S) topping pattern at the $30.00 highs of mid-April, Silver price declined to the initial target for the pattern at $26.70. This target was the conservative estimate for the pattern, calculated by taking the height of the H&S and extrapolating the distance by its 0.618 Fibonacci ratio from the neckline underpinning the pattern lower.
After bouncing from a temporary floor at $26.70 Silver price has consolidated forming a rectangle pattern. Taken together with the prior sharp decline the whole formation resembles a Bear Flag pattern.
According to technical lore, the expected move down from a Bear Flag equals the length of the preceding “pole” or a Fibonacci ratio of the pole. In this case the pole is the decline that followed the completion of the H&S pattern.
The Fibonacci 0.618 ratio of the pole on Silver, when extrapolated lower, gives a conservative target at $26.31. If Silver price falls the whole length of the pole (Fib. 1.000), however, it will reach a more "optimistic" target of $25.53.
Tough support from a long-term upper range boundary line at $25.80, however, is likely to offer support before Silver price reaches the lower target for the Bear Flag.
A break below the $26.69 low of April 23 would be required to confirm a breakdown of the Bear Flag towards its targets.
Forex News
Keep up with the financial markets, know what's happening and what is affecting the markets with our latest market updates. Analyze market movers, trends and build your trading strategies accordingly.


