Gold price steadies below $2,700 as traders seem reluctant ahead of US inflation data
- Gold price witnessed good two-way price moves amid some repositioning ahead of the US CPI report.
- Bets for a less dovish Fed and rising US bond yields underpin the USD, which caps the precious metal.
- Geopolitical risks, along with trade war fears help limit the downside for the safe-haven XAU/USD.
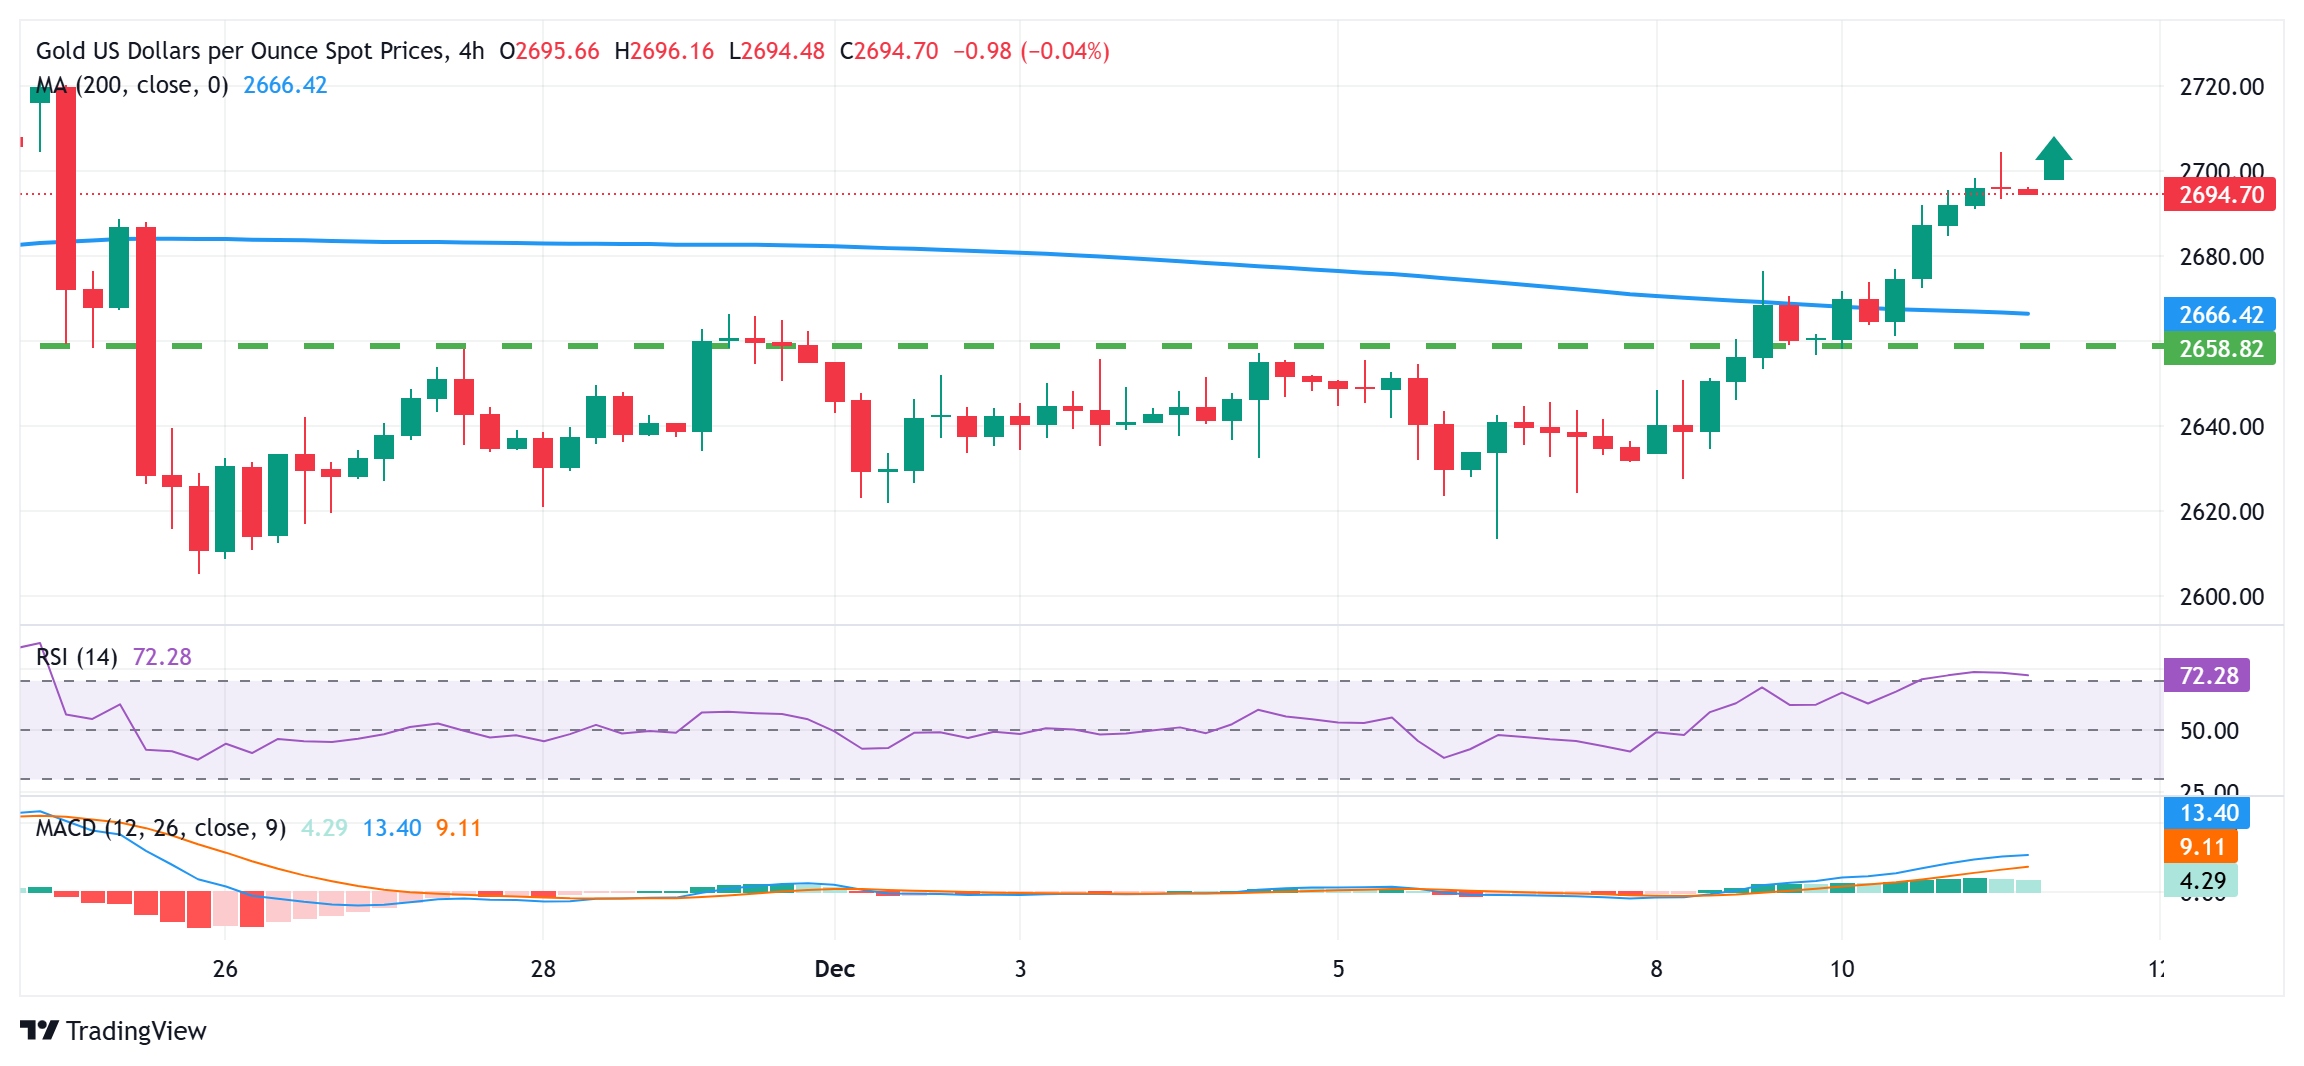
Gold price (XAU/USD) seems to have stabilized following good two-way intraday price swings and currently trades around the $2,690 area, below a two-week high touched earlier this Wednesday. Expectations that the Federal Reserve (Fed) will adopt a cautious stance on cutting rates continue to push the US Treasury bond yields. This assists the US Dollar (USD) to prolong its positive trend for the fourth straight day and climb to a one-week top. This, in turn, acts as a headwind for the bullion, though geopolitical risks and trade war fears continue to offer some support to the safe-haven commodity.
Traders also seem reluctant to place aggressive directional bets and opt to wait on the sidelines ahead of the release of the US consumer inflation figures, which further contributes to infusing volatility around the Gold price. The crucial US Consumer Price Index (CPI) report, due for release later during the North American session, will guide Fed policymakers on their decision next week. This, in turn, will play a key role in influencing the USD price dynamics and determining the near-term trajectory for the commodity ahead of the highly-anticipated two-day FOMC meeting next week.
Gold price traders seem reluctant to place aggressive directional bets ahead of US CPI report
- Israel launched airstrikes at military targets across Syria and deployed ground troops beyond a demilitarized buffer zone for the first time in 50 years following the collapse of President Bashar al-Assad's regime over the weekend.
- Ukraine's President Volodymyr Zelenskyy issued orders to increase funding for equipping brigades with new drones and raised the idea of foreign troops being deployed in Ukraine until it could join the NATO military alliance.
- US President-elect Donald Trump has pledged to impose big tariffs against America’s three largest trading partners – Mexico, Canada and China – and also threatened a 100% tariff on the so-called 'BRICS' nations.
- The Bank of Canada is expected to cut rates later today, while the European Central Bank and the Swiss National Bank are likely to follow suit on Thursday, which should continue to support the non-yielding Gold price.
- According to the CME Group's FedWatch Tool, the markets are currently pricing in over an 85% probability that the Federal Reserve will lower borrowing costs by 25 basis points at its December policy meeting.
- However, the recent hawkish remarks from several influential FOMC members, including Fed Chair Jerome Powell, suggested that the US central bank might adopt a more cautious stance on cutting interest rates.
- Expectations for a less dovish Fed assisted the US Treasury bond yields to finish higher for the second day on Tuesday and lifted the US Dollar to a four-day high, albeit did little to dent the bullish sentiment around the precious metal.
- The market focus remains glued to the crucial US Consumer Price Index (CPI) report, which might offer cues about the interest rate outlook in the US and provide a fresh impetus to the non-yielding XAU/USD.
- The headline US CPI is expected to increase by 0.3% in November and rise by 2.7% on a yearly basis. Meanwhile, the core gauge (excluding food and energy prices) is forecast to remain unchanged at the 3.3% YoY rate.
Gold price technical setup favors bullish traders; sutained strength beyond $2,700 awaited
From a technical perspective, this week's breakout through the $2,650-2,655 supply zone and the subsequent move up favors bullish traders. Moreover, oscillators on the daily chart have been gaining positive traction and are still far from being in the overbought territory. This, in turn, validates the near-term positive outlook for the Gold price and supports prospects for the emergence of some dip-buying near the aforementioned resistance breakpoint. This should help limit the downside for the XAU/USD near the $2,630 area, below which the downward trajectory could extend further towards the $2,600 round figure.
On the flip side, a sustained move beyond the $2,700 round figure could extend further towards the $2,720-2,722 hurdle. This is followed by resistance near the $2,735 region, which if cleared will suggest that the recent corrective decline from the all-time high touched in October has run its course and shift the bias in favor of bullish traders. The momentum might then lift the Gold price to the $2,758-2,760 barrier en route to the $2,770-2,772 region and the $2,790 area, or the record peak.
Economic Indicator
Consumer Price Index (YoY)
Inflationary or deflationary tendencies are measured by periodically summing the prices of a basket of representative goods and services and presenting the data as The Consumer Price Index (CPI). CPI data is compiled on a monthly basis and released by the US Department of Labor Statistics. The YoY reading compares the prices of goods in the reference month to the same month a year earlier.The CPI is a key indicator to measure inflation and changes in purchasing trends. Generally speaking, a high reading is seen as bullish for the US Dollar (USD), while a low reading is seen as bearish.
Read more.Next release: Wed Dec 11, 2024 13:30
Frequency: Monthly
Consensus: 2.7%
Previous: 2.6%
Source: US Bureau of Labor Statistics
The US Federal Reserve has a dual mandate of maintaining price stability and maximum employment. According to such mandate, inflation should be at around 2% YoY and has become the weakest pillar of the central bank’s directive ever since the world suffered a pandemic, which extends to these days. Price pressures keep rising amid supply-chain issues and bottlenecks, with the Consumer Price Index (CPI) hanging at multi-decade highs. The Fed has already taken measures to tame inflation and is expected to maintain an aggressive stance in the foreseeable future.
Forex News
Keep up with the financial markets, know what's happening and what is affecting the markets with our latest market updates. Analyze market movers, trends and build your trading strategies accordingly.


