EUR/USD bounces back into positive territory after release of US PMIs
- EUR/USD rebounds after the release of US PMIs show a lower-then-expected reading.
- EUR/USD overcomes earlier weakness driven by the HCOB Manufacturing PMI which fell deeper into contraction territory.
- The pair has formed a Bear Flag price pattern suggesting the potential for a steep decline.
EUR/USD recovers from earlier weakness after the release of lower-than-expected US PMI data brings into question US economic exceptionalism and weakens the US Dollar (USD) on Tuesday. The pair manages to undo the damage from earlier losses following the release of preliminary Eurozone Purchasing Manager Index (PMI) data for April.
EUR/USD recovers after US PMI data underwhelms
EUR/USD recovers into positive territory after the release of preliminary S&P Global PMI data for the United States shows readings that were lower than economists had forecast, weakening the US Dollar. The S&P Global Manufacturing PMI also fell into contraction territory after giving a reading of 49.9, which is below the 50 that distinguishes growth from contraction. The result was considerably lower than the 51.9 of March and the 52.0 forecast. The S&P Global Composite PMI came out at 50.9 from 52.1 previously.
The S&P Global Services PMI fell to 50.9 from 51.7 in March and below the 52.0 forecast. Services data is particularly important for the USD since the sector has been highlighted as especially responsible for the sticky inflation in the US. This has led many investors to speculate the Federal Reserve (Fed) will maintain interest rates at elevated levels longer than was expected at the start of the year. Higher interest rates are positive for a currency as they generate higher foreign capital inflows.
The lower-than-expected data, however, may recalibrate Fed interest rate expectations, leading to a revival of bets the Fed could start cutting interest rates in the near-term. After the release of the data, market gauges of the probability the Fed will cut interest rates indicated a first rate cut by September.
New Home Sales data for March, also out on Tuesday probably supported the Greenback after it came out higher than expectations, with an 8.8% rise against the negative 5.1% in February, and 0.693 million homes sold, versus the 0.668M expected and 0.637 previous figure.
EUR/USD falls after weak Manufacturing PMI data
EUR/USD declined earlier on Tuesday, after the release of the HCOB Manufacturing PMI missed estimates, falling to 45.6 in April versus the 46.5 expected and 46.1 of March.
HCOB Composite PMI for the Eurozone rose to 51.4, however, which was above the 50.8 forecast and the 50.3 in March. The gain was driven by the HCOB Services PMI which increased to 52.9 in April – higher than both the 51.8 forecast and the 51.5 previous.
Technical Analysis: EUR/USD forms a Bear Flag
EUR/USD is trading in a rectangular range at roughly the same level as the 100-week Simple Moving Average (SMA).
Taken together with the steep decline that preceded the rectangle, the whole formation resembles a Bear Flag price pattern, which has bearish connotations.
EUR/USD 4-hour Chart
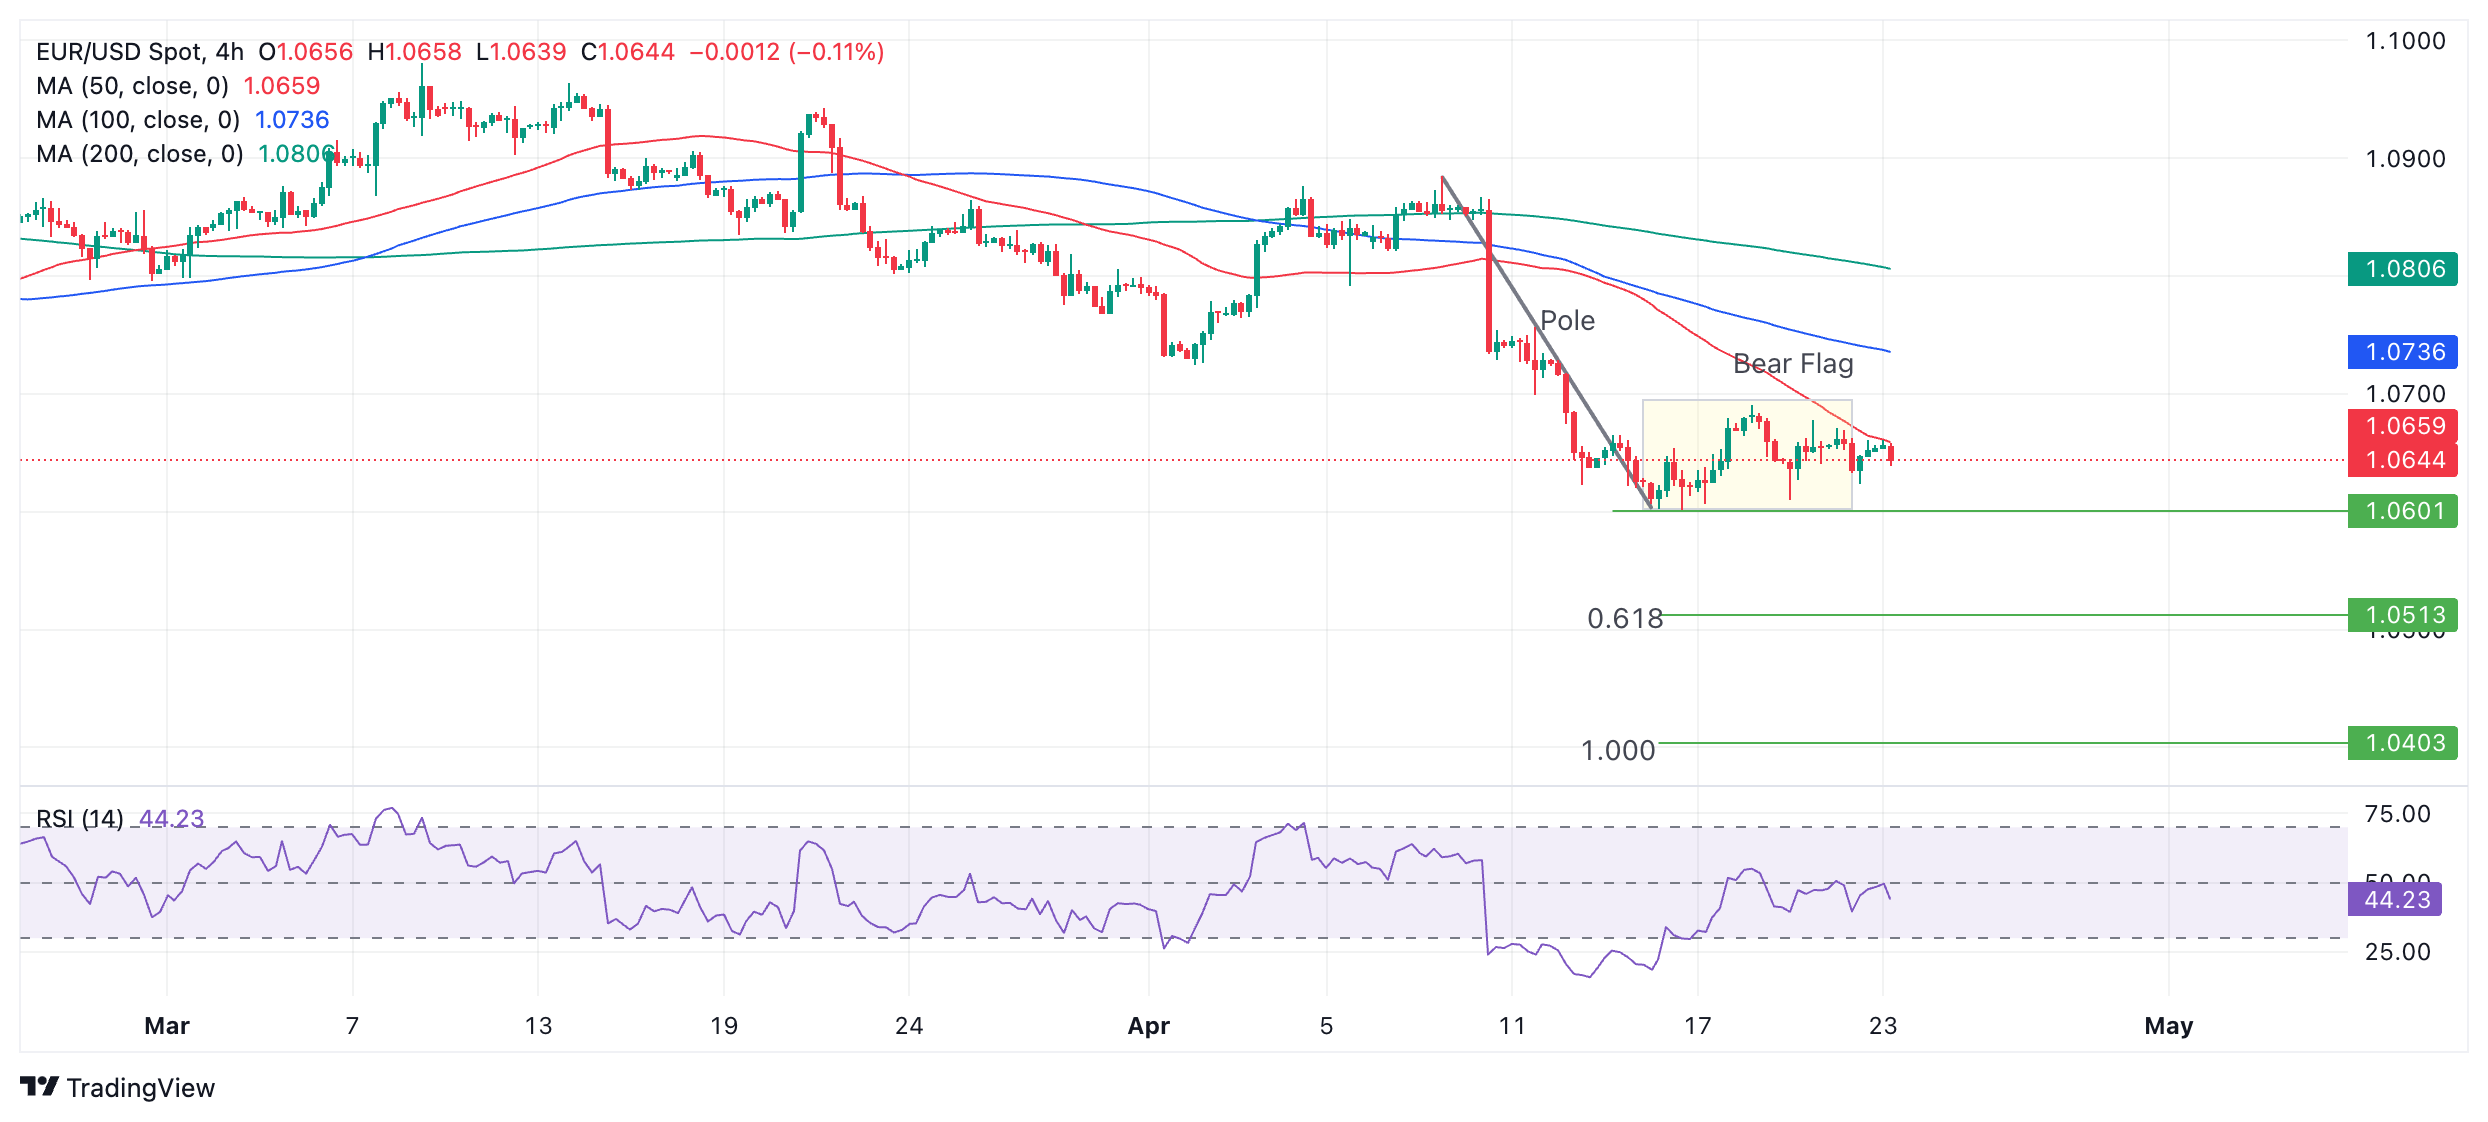
A break below the 1.0601 April 16 low would signal a probable activation of the Bear Flag and the start of a decline.
According to technical lore, the expected move out of a Bear Flag usually equals the length of the “pole” or steep decline preceding the box-like formation of the flag square, or a Fibonacci ratio of the pole.
The Fibonacci 0.618 ratio of the pole extrapolated lower provides the most reliable conservative target. This gives a price objective at 1.0503. After that, the next concrete target is at 1.0446 – the October 2023 low. A fall of equal length to the pole would take EUR/USD down to 1.0403.
The Relative Strength Index (RSI) has exited oversold conditions, indicating renewed potential for more downside.
For bulls, resistance at around 1.0700 will need to be overcome to have any hope of recovery. After that, the April 2 swing low at 1.0725 provides the next upside target, followed by 1.0800, where a cluster of major Moving Averages coils.
Economic Indicator
S&P Global Manufacturing PMI
The S&P Global Manufacturing Purchasing Managers Index (PMI), released on a monthly basis, is a leading indicator gauging business activity in the US manufacturing sector. The data is derived from surveys of senior executives at private-sector companies from the manufacturing sector. Survey responses reflect the change, if any, in the current month compared to the previous month and can anticipate changing trends in official data series such as Gross Domestic Product (GDP), industrial production, employment and inflation. A reading above 50 indicates that the manufacturing economy is generally expanding, a bullish sign for the US Dollar (USD). Meanwhile, a reading below 50 signals that activity in the manufacturing sector is generally declining, which is seen as bearish for USD.
Read more.Last release: Tue Apr 23, 2024 13:45 (Prel)
Frequency: Monthly
Actual: 49.9
Consensus: 52
Previous: 51.9
Source: S&P Global
Forex News
Keep up with the financial markets, know what's happening and what is affecting the markets with our latest market updates. Analyze market movers, trends and build your trading strategies accordingly.