AUD/JPY Price Analysis: Bears in charge as pair dips toward 102.00
- AUD/JPY declines 0.77% amid reactions to recent Bank of Japan interventions.
- Key support levels are at 101.35 and the April 25 low of 100.77, ahead of 100.00.
- Should the pair climb above 102.00, it might aim to retest resistance at 102.84 and potentially push towards the year-to-date high of 104.95.
The Aussie Dollar extends its losses against the Japanese Yen for the second straight day, following an intervention by the Bank of Japan (BoJ) on Monday, which kept the pair seesawing in the 101.37/104.95 range. Late in the North American session, the AUD/JPY trades at 102.18, down 0.77%.
AUD/JPY Price Analysis: Technical outlook
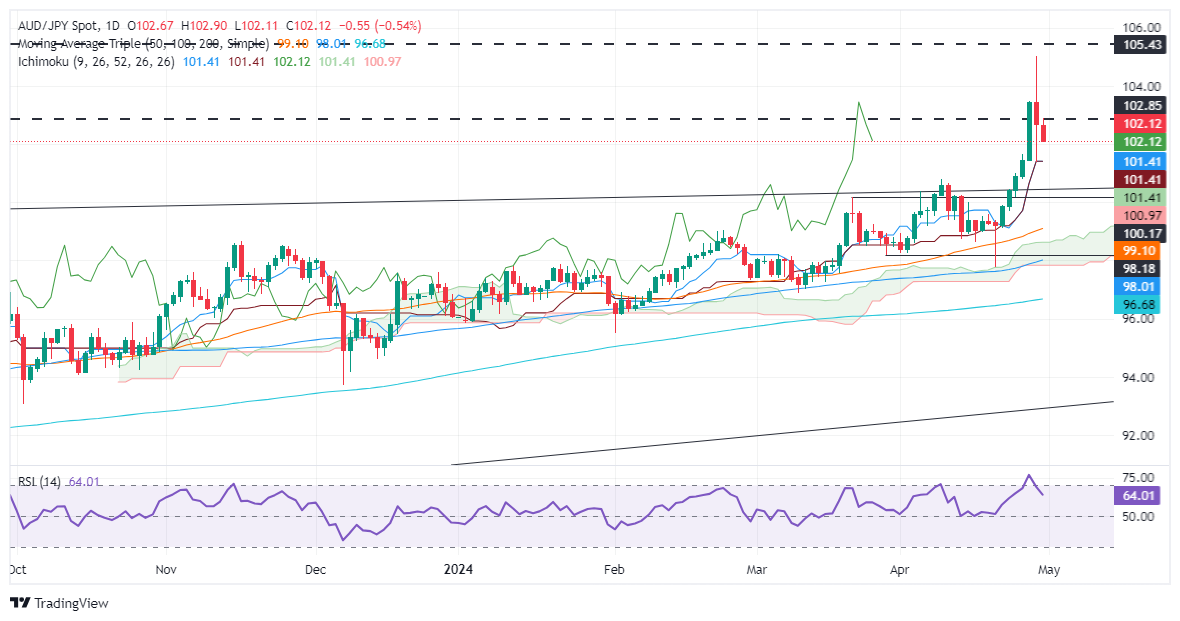
The AUD/JPY daily chart suggests the pair is upward biased despite retreating below the 103.00 figure. Subsequent losses are seen below the Tenkan and Kijun-Sen levels at 101.35, followed by the April 25 low at 100.77. A breach of the latter will expose the 100.00 threshold, followed by the April 22 low at 99.05.
On the other hand, the uptrend might resume if buyers hold the AUD/JPY exchange rate above 102.00. The first resistance would be the 2014 high at 102.84, followed by the 103.00 mark. Once cleared, the next stop would be the year-to-date (YTD) high at 104.95.
AUD/JPY Price Action – Daily Chart
Forex News
Keep up with the financial markets, know what's happening and what is affecting the markets with our latest market updates. Analyze market movers, trends and build your trading strategies accordingly.