Gold price flirts with multi-week top despite bullish USD; seems poised to climb further
- Gold price turns positive for the third straight day and draws support from a combination of factors.
- Geopolitical risks, trade war fears and retreating US bond yields lend support to the XAU/USD pair.
- Traders now look forward to Fed speakers for some impetus ahead of the US NFP report on Friday.
Gold price (XAU/USD) regains positive traction following an intraday dip to the $2,655 area, albeit it lacks follow-through and remains below a four-week high through the first half of the European session on Thursday. The US Dollar (USD) stands firm near a two-year high and continues to draw support from the Federal Reserve's (Fed) hawkish signal that it would slow the pace of rate cuts in 2025, which, in turn, seems to cap the non-yielding yellow metal. That said, a combination of factors acts as a tailwind for the commodity and supports prospects for an extension of a near three-week-old uptrend.
Persistent geopolitical risks, along with concerns about US President-elect Donald Trump's tariff plans, continue to weigh on investors' sentiment. This is evident from the prevalent cautious market mood and lends support to the safe-haven Gold price. Meanwhile, the flight to safety triggers a modest pullback in the US Treasury bond yields, which might hold back the USD bulls from placing fresh bets and validate the positive outlook for the XAU/USD. Traders now look to speeches by influential FOMC members for some impetus ahead of the crucial US Nonfarm Payrolls (NFP) report on Friday.
Gold price remains supported by softer risk tone, retreating US bond yields
- Automatic Data Processing (ADP) reported that private sector payrolls in the US rose by 122,000 in December, well below November's increase of 146,000 and missing expectations of 140,000.
- A separate Labor Department report showed Initial Jobless Claims stood at 201,000 in the week ending January 4, marking the lowest reading since February 2024 and pointing to a stable labor market.
- Minutes of the December FOMC meeting showed that policymakers viewed labor market conditions as gradually easing and were in favor of slowing the pace of rate cuts amid stalling disinflation.
- The yield on the benchmark 10-year US government bond shot to its highest level since April 25 on Wednesday, assisting the US Dollar to stand firm near a two-year top and undermining the Gold price.
- CNN reported that US President-elect Donald Trump is considering declaring a national economic emergency to provide legal justification for a series of universal tariffs on allies and adversaries.
- Ukrainian troops endured significant manpower losses in the face of Russia’s relentless assault. Russia's Defence Ministry said that its forces defeated Ukrainian brigades in Seversk and Chasov Yar.
- Israeli airstrikes continued across the West Bank on Wednesday in the wake of an attack that killed three Israelis on Monday. The Israeli military recovered the body of a hostage from southern Gaza.
- Investors now look to speeches by a slew of influential FOMC members for short-term impetus later during the US session, though the focus will remain glued to the US Nonfarm Payrolls on Friday.
Gold price bulls retain control, dip-buying should limit any corrective slide
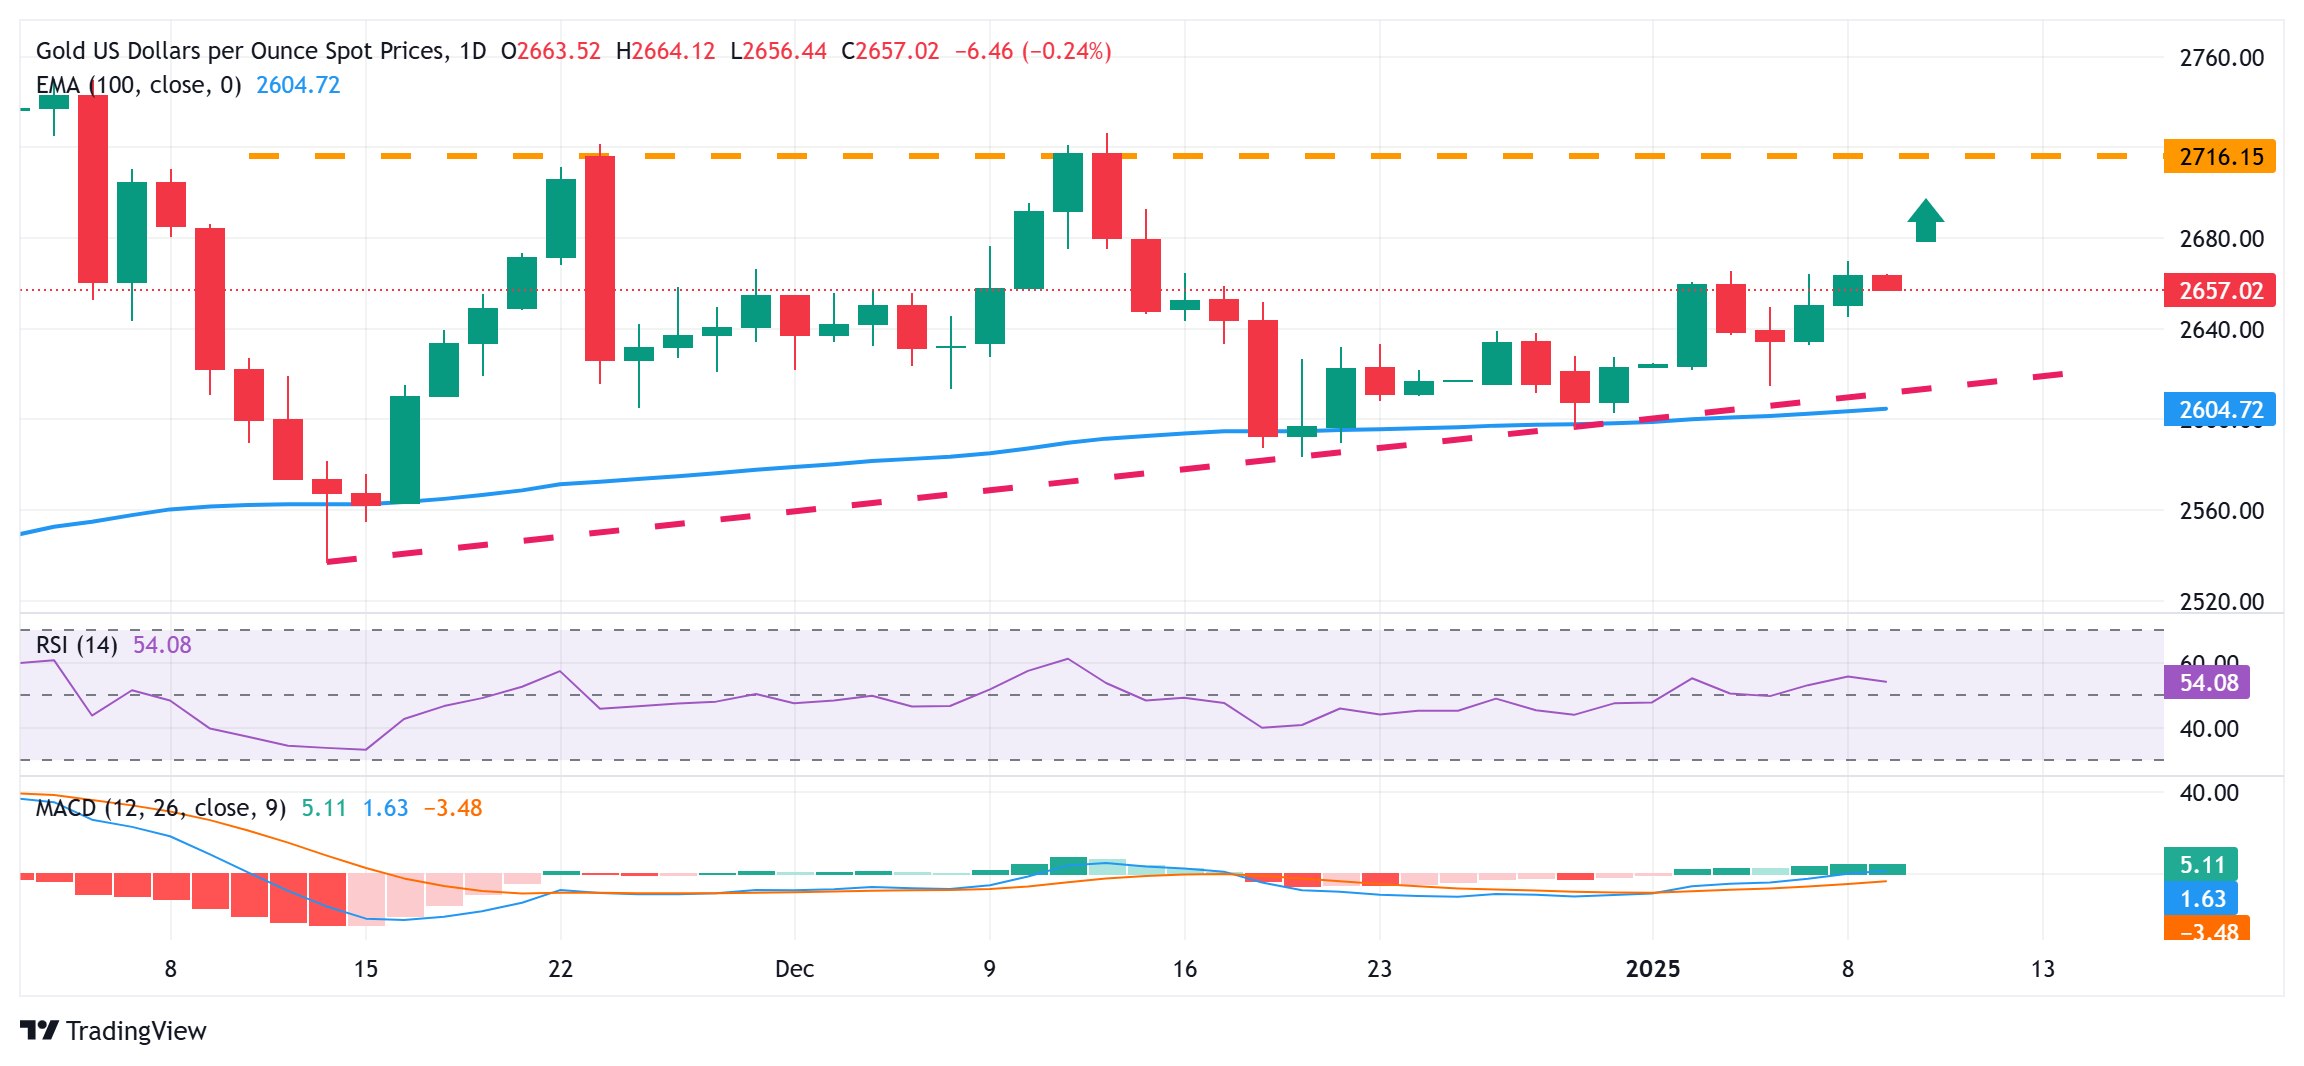
From a technical perspective, the overnight swing high, around the $2,670 area, now seems to act as an immediate hurdle, which if cleared will be seen as a fresh trigger for bullish traders. Given that oscillators on the daily chart have started moving in positive territory, the Gold price might then climb to an intermediate resistance near the $2,681-2,683 zone en route to the $2,700 mark.
On the flip side, any further slide is likely to find support near the $2,645 area ahead of the $2,635 region and the weekly low, around the $2,615-2,614 zone touched on Monday. Some follow-through selling below the $2,600 confluence, comprising the 100-day Exponential Moving Average (EMA) and a short-term ascending trend line extending from the November monthly low, will be seen as a fresh trigger for bearish traders. The Gold price might then turn vulnerable to slide further below the December swing low, around the $2,583 area, and test the next relevant support near the $2,550 zone.
US Dollar PRICE Today
The table below shows the percentage change of US Dollar (USD) against listed major currencies today. US Dollar was the strongest against the British Pound.
| USD | EUR | GBP | JPY | CAD | AUD | NZD | CHF | |
|---|---|---|---|---|---|---|---|---|
| USD | 0.17% | 0.64% | -0.17% | 0.03% | 0.45% | 0.39% | 0.04% | |
| EUR | -0.17% | 0.47% | -0.31% | -0.14% | 0.30% | 0.22% | -0.12% | |
| GBP | -0.64% | -0.47% | -0.80% | -0.61% | -0.18% | -0.24% | -0.57% | |
| JPY | 0.17% | 0.31% | 0.80% | 0.18% | 0.61% | 0.50% | 0.21% | |
| CAD | -0.03% | 0.14% | 0.61% | -0.18% | 0.43% | 0.36% | 0.03% | |
| AUD | -0.45% | -0.30% | 0.18% | -0.61% | -0.43% | -0.08% | -0.39% | |
| NZD | -0.39% | -0.22% | 0.24% | -0.50% | -0.36% | 0.08% | -0.32% | |
| CHF | -0.04% | 0.12% | 0.57% | -0.21% | -0.03% | 0.39% | 0.32% |
The heat map shows percentage changes of major currencies against each other. The base currency is picked from the left column, while the quote currency is picked from the top row. For example, if you pick the US Dollar from the left column and move along the horizontal line to the Japanese Yen, the percentage change displayed in the box will represent USD (base)/JPY (quote).
Forex News
Keep up with the financial markets, know what's happening and what is affecting the markets with our latest market updates. Analyze market movers, trends and build your trading strategies accordingly.

