
NZD/USD Price Analysis: Bears back off, potential trend reversal on cards tied to 20-day SMA recovery
- The daily chart reveals a bearish bias for the NZD/USD pair underlined by its positioning below major SMAs.
- For bullish traction to take place, buyers must reclaim control over the 20-day SMA SMAs.
- Indicators on the daily chart recovered.
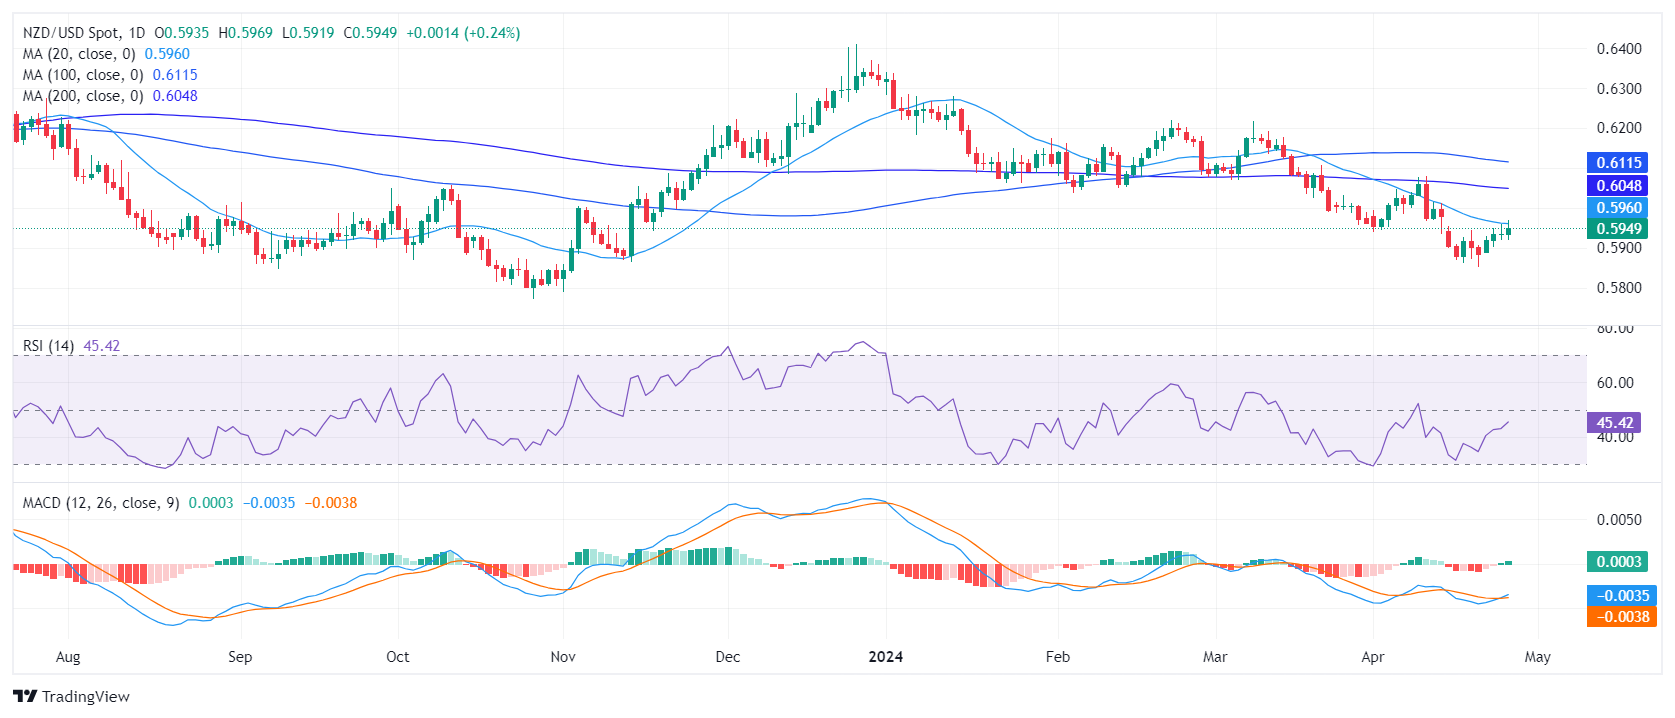
The NZD/USD pair stands at 0.5949, registering daily gains on Thursday’s session. The prevailing outlook, as presented on the daily chart, shows a strong bearish control as the Kiwi continues to trade below the significant Simple Moving Averages (SMAs). Minor upticks visible in the short term do not suggest a meaningful trend reversal. For a bullish revival, bears must cede control to the buyers who would then need to gain the upper hand over the key 20-day SMA to start talking.
On the daily chart, The Relative Strength Index (RSI) for the NZD/USD pair continues within a negative trend territory. However, some signals of possible market correction exist as the RSI values hint at upward momentum. Simultaneously, the Moving Average Convergence Divergence (MACD) shows rising green bars, indicating buyers are gradually edging in against the sellers, lending positive momentum to the market.
NZD/USD daily chart
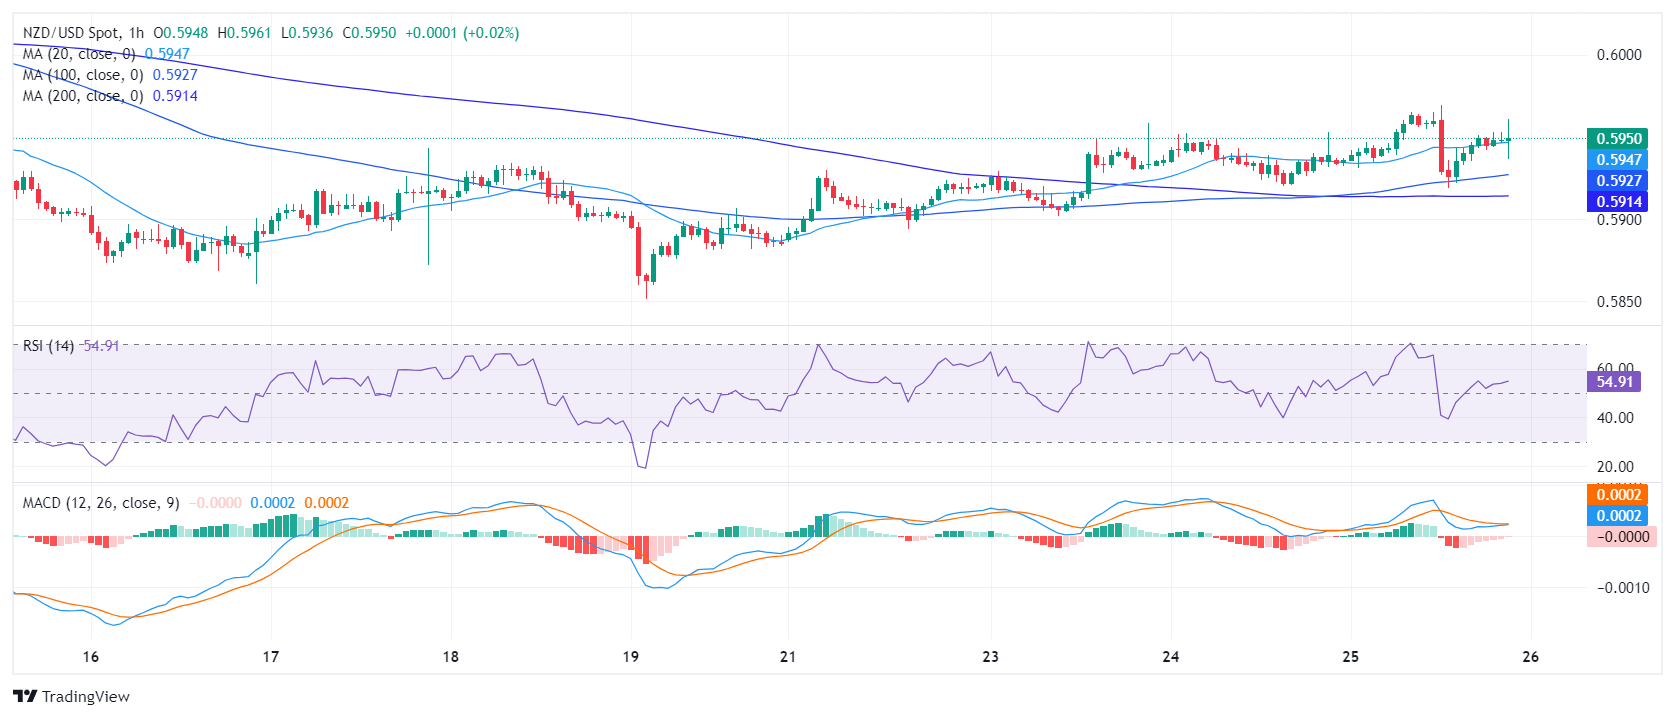
Moving on to the hourly chart, the RSI also persists in a negative trend, but the latest hour displays an upswing, carrying the indicator above the 50 mark which, paired with decreasing red bars on the MACD histogram, might suggest a short-term trend reversal or correction.
NZD/USD hourly chart
Assessing the overall landscape, the NZD/USD is in a definitive downtrend, underpinned by its position below the 20, 100, and 200-day Simple Moving Averages (SMAs). This situation suggests a prolonged bearish momentum as both short-term and long-term traders are selling the pair. Thursday's price movement raises another red flag as an attempted recovery by buyers has been rejected at the 20-day SMA at the 0.5960 level, suggesting a lack of bullish conviction and the potential for further downside. With these considerations, the outlook remains tilted in favor of sellers.
Forex News
Keep up with the financial markets, know what's happening and what is affecting the markets with our latest market updates. Analyze market movers, trends and build your trading strategies accordingly.


