
AUD/USD continues rising after inflation in Q1 proves stickier-than-expected
- AUD/USD continues its recovery after Australian Q1 CPI data shows inflation stickier-than-forecast.
- The result is likely to keep interest rates in Australia higher for a longer time than other G10 nations.
- Bullish reversal signs are increasing on charts, suggesting the possibility of a trend reversal in the making.
AUD/USD trades off the highs of the day just below 0.6500 on Wednesday, after peaking at 0.6530 overnight following the release of stickier-than-expected Australian inflation data, which showed price gains were higher in Q1 than economists had predicted.
The Q1 Consumer Price Index (CPI) data rose by 3.6% instead of the 3.4% the market had expected, and the price stickiness reflected in the data suggests the Reserve Bank of Australia (RBA) will be even less likely to cut interest rates in the near-term.
The CPI data was a catalyst for an extension of the recovery in AUD/USD since the expectations of interest rates remaining high for longer is positive for the Australian Dollar. Higher interest rates mean more foreign capital inflows, boosting demand for AUD.
AUD/USD leads major currencies after CPI data
AUD/USD has seen three up-days in a row on Wednesday (so far), and it is the strongest performing G10 currency over a five-day view.
Due to persistent inflation, of which Wednesday’s CPI data is further evidence, the RBA is seen as the last major G10 central bank to cut interest rates, according to Rabobank. This in turn is likely to provide a backwind for the Aussie Dollar.
“Ahead of this morning’s release of Australian Q1 CPI inflation data, the market was already of the view that the RBA would be one of the last G10 central banks to cut rates this cycle. Today’s stronger than expected readings reinforces this risk and highlights Rabobank’s house view that the RBA’s forthcoming easing cycle is likely to be extremely shallow,” Rabobank said in a note on Wednesday.
The higher-than-expected inflation rate in Q1 is likely to force the RBA to revise up its inflation forecasts at the May meeting. Taken together with the weak US PMI data on Tuesday, which dented the myth of US economic exceptionalism, Rabobank are of the view that AUD/USD will continue higher.
“This week’s US and Australia data releases have reinforced our view that AUD/USD is likely to trend higher later in the year and into 2025.”
The RBA is now unlikely to make its first rate cut until November, says the bank.
“Market implied policy rates are currently pointing to a very small increase in the cash rate on a 6-month view, which reflects the rise in skepticism about the ability of the RBA to cut rates at all this year. Rabobank’s view is that the RBA will cut rates only twice in the forthcoming cycle starting in November,” Rabobank said.
An RBA cut in November now unlikely, says TD Securities
Analysts at TD Securities go further and scrap their call for the RBA to cut interest rates in November, seeing a rate cut now not materializing till February 2025.
“We now expect the RBA to deliver its first cut in Feb’25. The RBA is likely to adopt a more hawkish stance, but one that it's loath to act upon. Paying Aug'24 RBA OIS as insurance makes sense,” says TD Securities.
If they are right then this is likely to fuel an even stronger rise in AUD/USD.
AUD/USD still unlikely to rise unless US yields fall – Societe Generale
It is important to consider the other side of the AUD/USD pair too – the US Dollar.
AUD/USD will remain stuck even after the stickier Q1 data unless US yields provide a helping hand by also falling, according to analysts at Societe Generale.
“It would still take a retracement in US yields for AUD/USD to gain traction above 0.6500, even if the RBA is less likely to cut rates this year,” they comment.
Technical Analysis: AUD/USD showing signs of a bullish reversal
AUD/USD is showing some early technical signs that point to a possible bullish reversal.
This is especially the case on the 4-hour and daily charts.
The AUD/USD daily chart below shows a bullish Dragonfly Doji candlestick reversal pattern at the recent Friday April 19 lows. This was followed by a green up day on Monday, providing bullish confirmation.
The inference is that AUD/USD is undergoing a reversal, albeit one of short duration.
AUD/USD Daily Chart
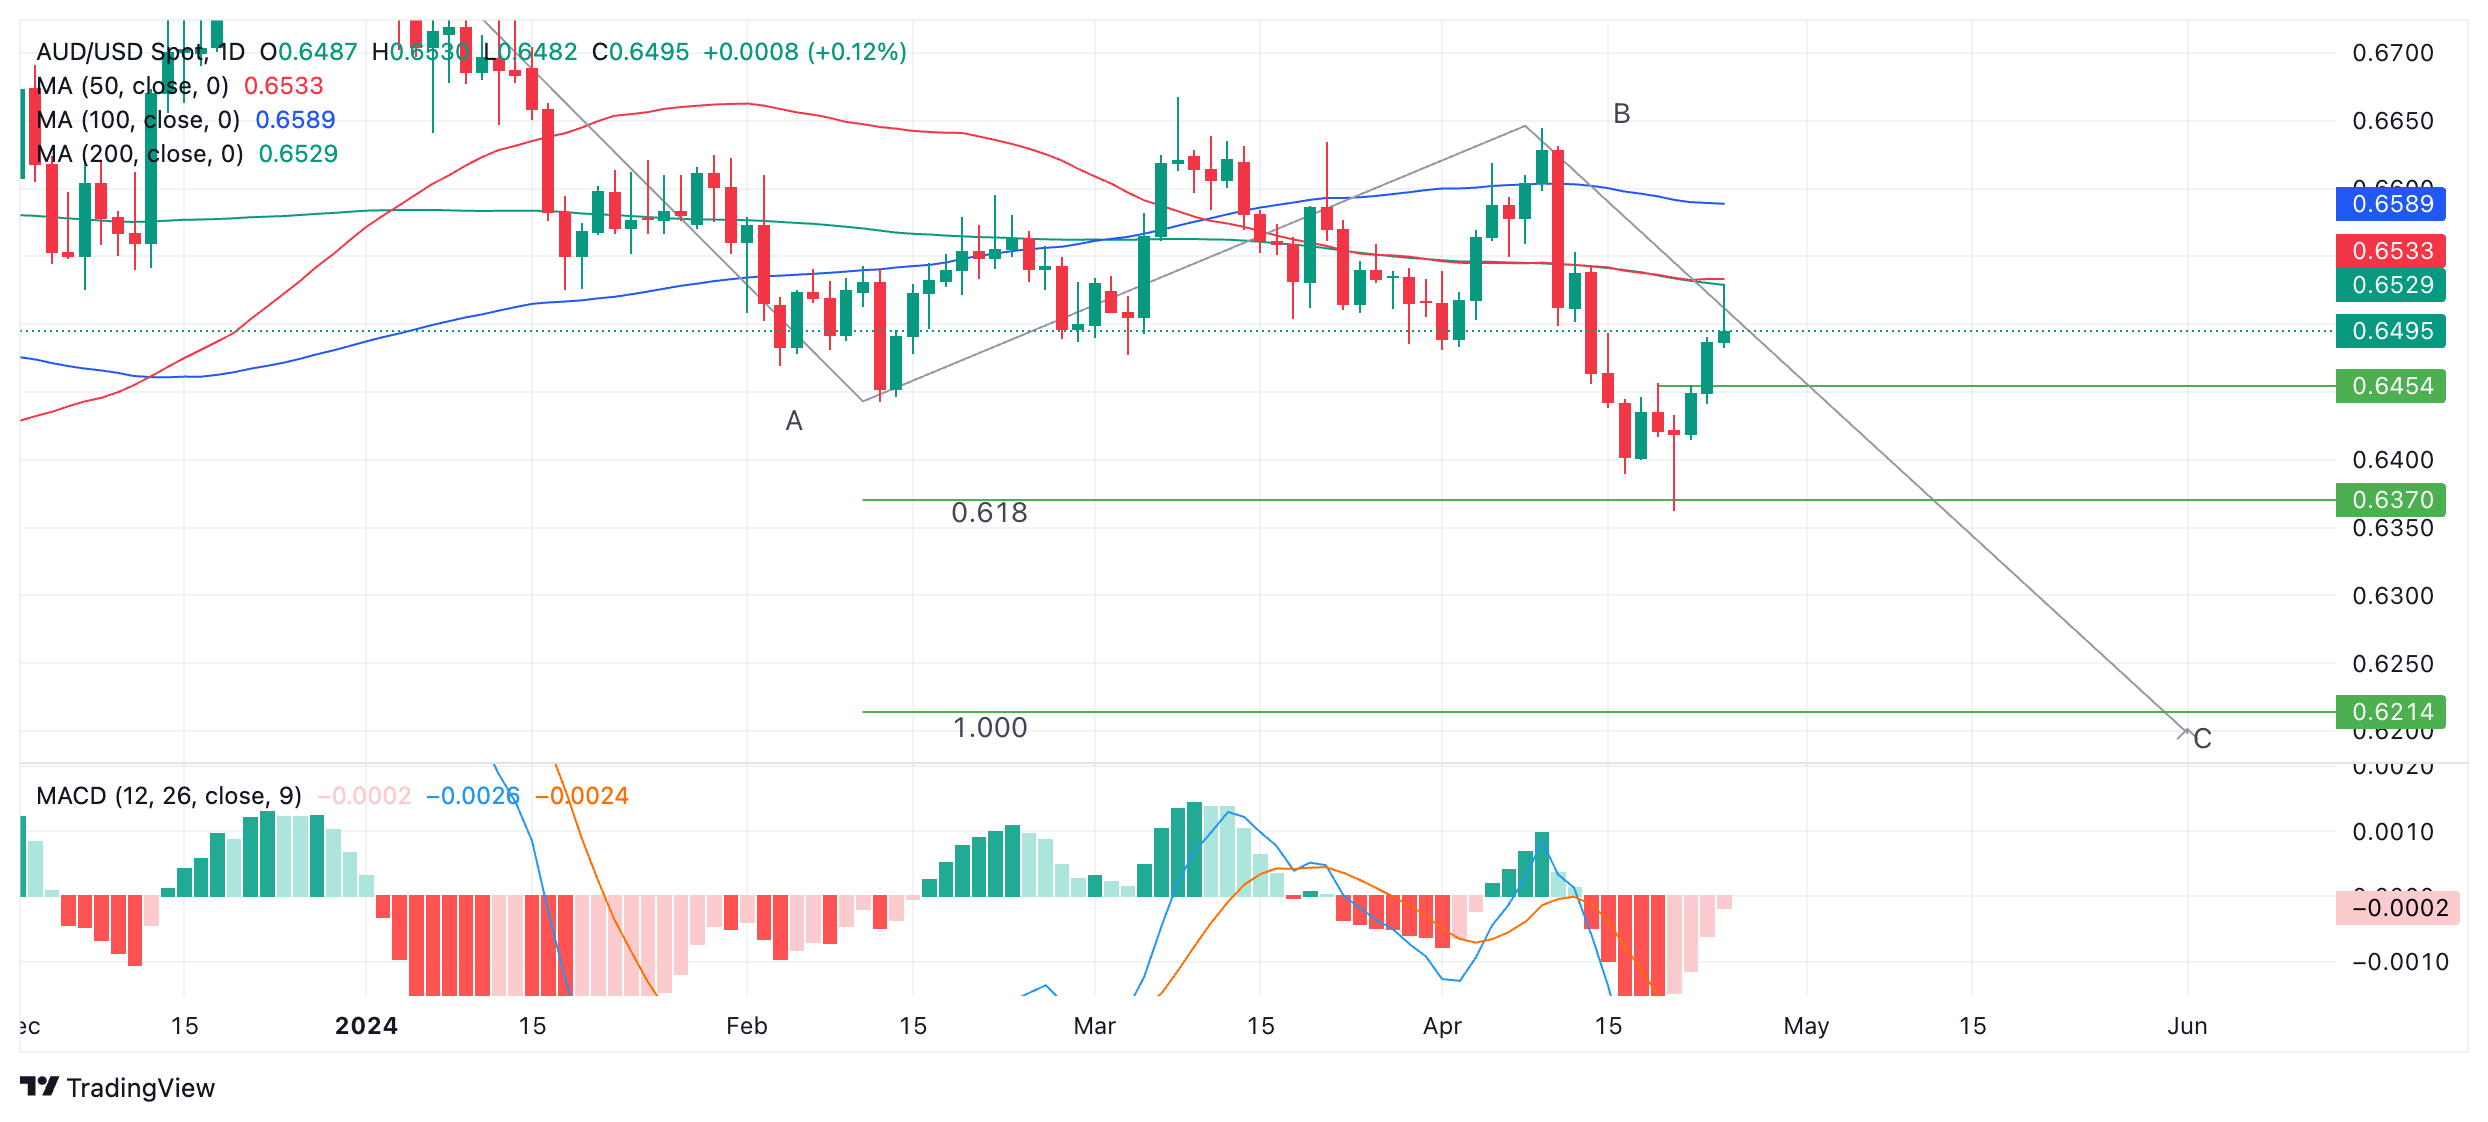
If Wednesday ends as a green up-candle as looks likely it will provide further evidence the trend is reversing, since according to technical analysts three consecutive up-days are a sign of trend reversal.
AUD/USD’s 4-hour chart is also showing bullish reversal insignia and it could be argued the trend in the short-term has now reversed.
4-hour Chart
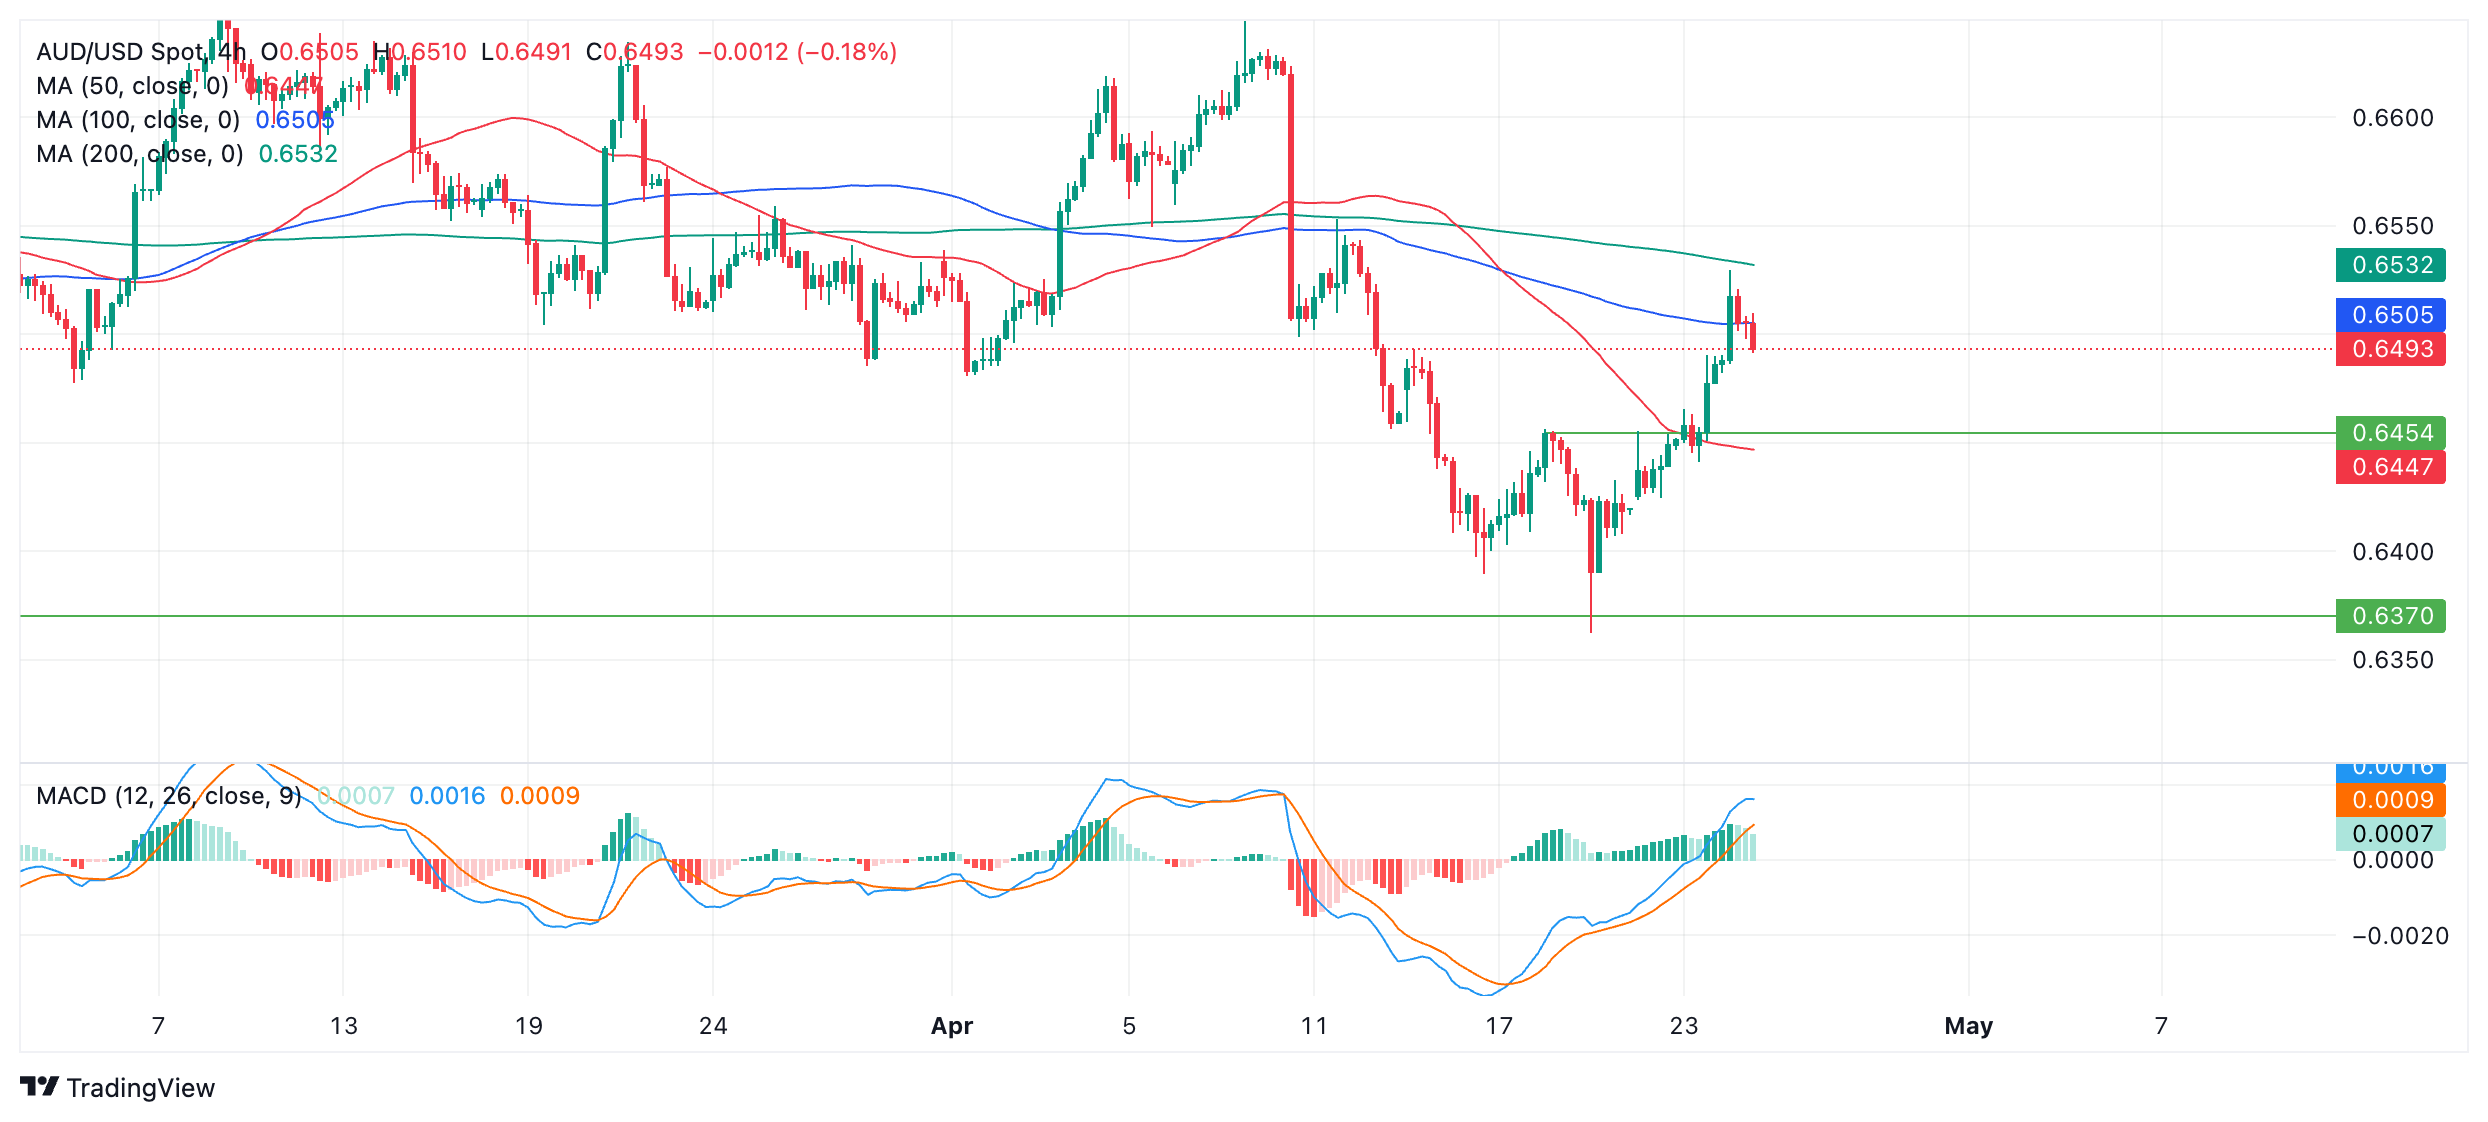
The pair has risen above the last lower high of the downtrend at 0.6452 and has broken above the 50-4hr SMA. These are both quite bullish signs.
In addition, the accompanying MACD, during the recovery from the April 19 lows, has been strongly bullish, rising more quickly than it fell over a similar timespan. This shows bullish enthusiasm and potentially institutional buyers could be participating.
The MACD has also now risen above the zero line adding more bullish evidence to the argument.
AUD/USD Weekly Chart
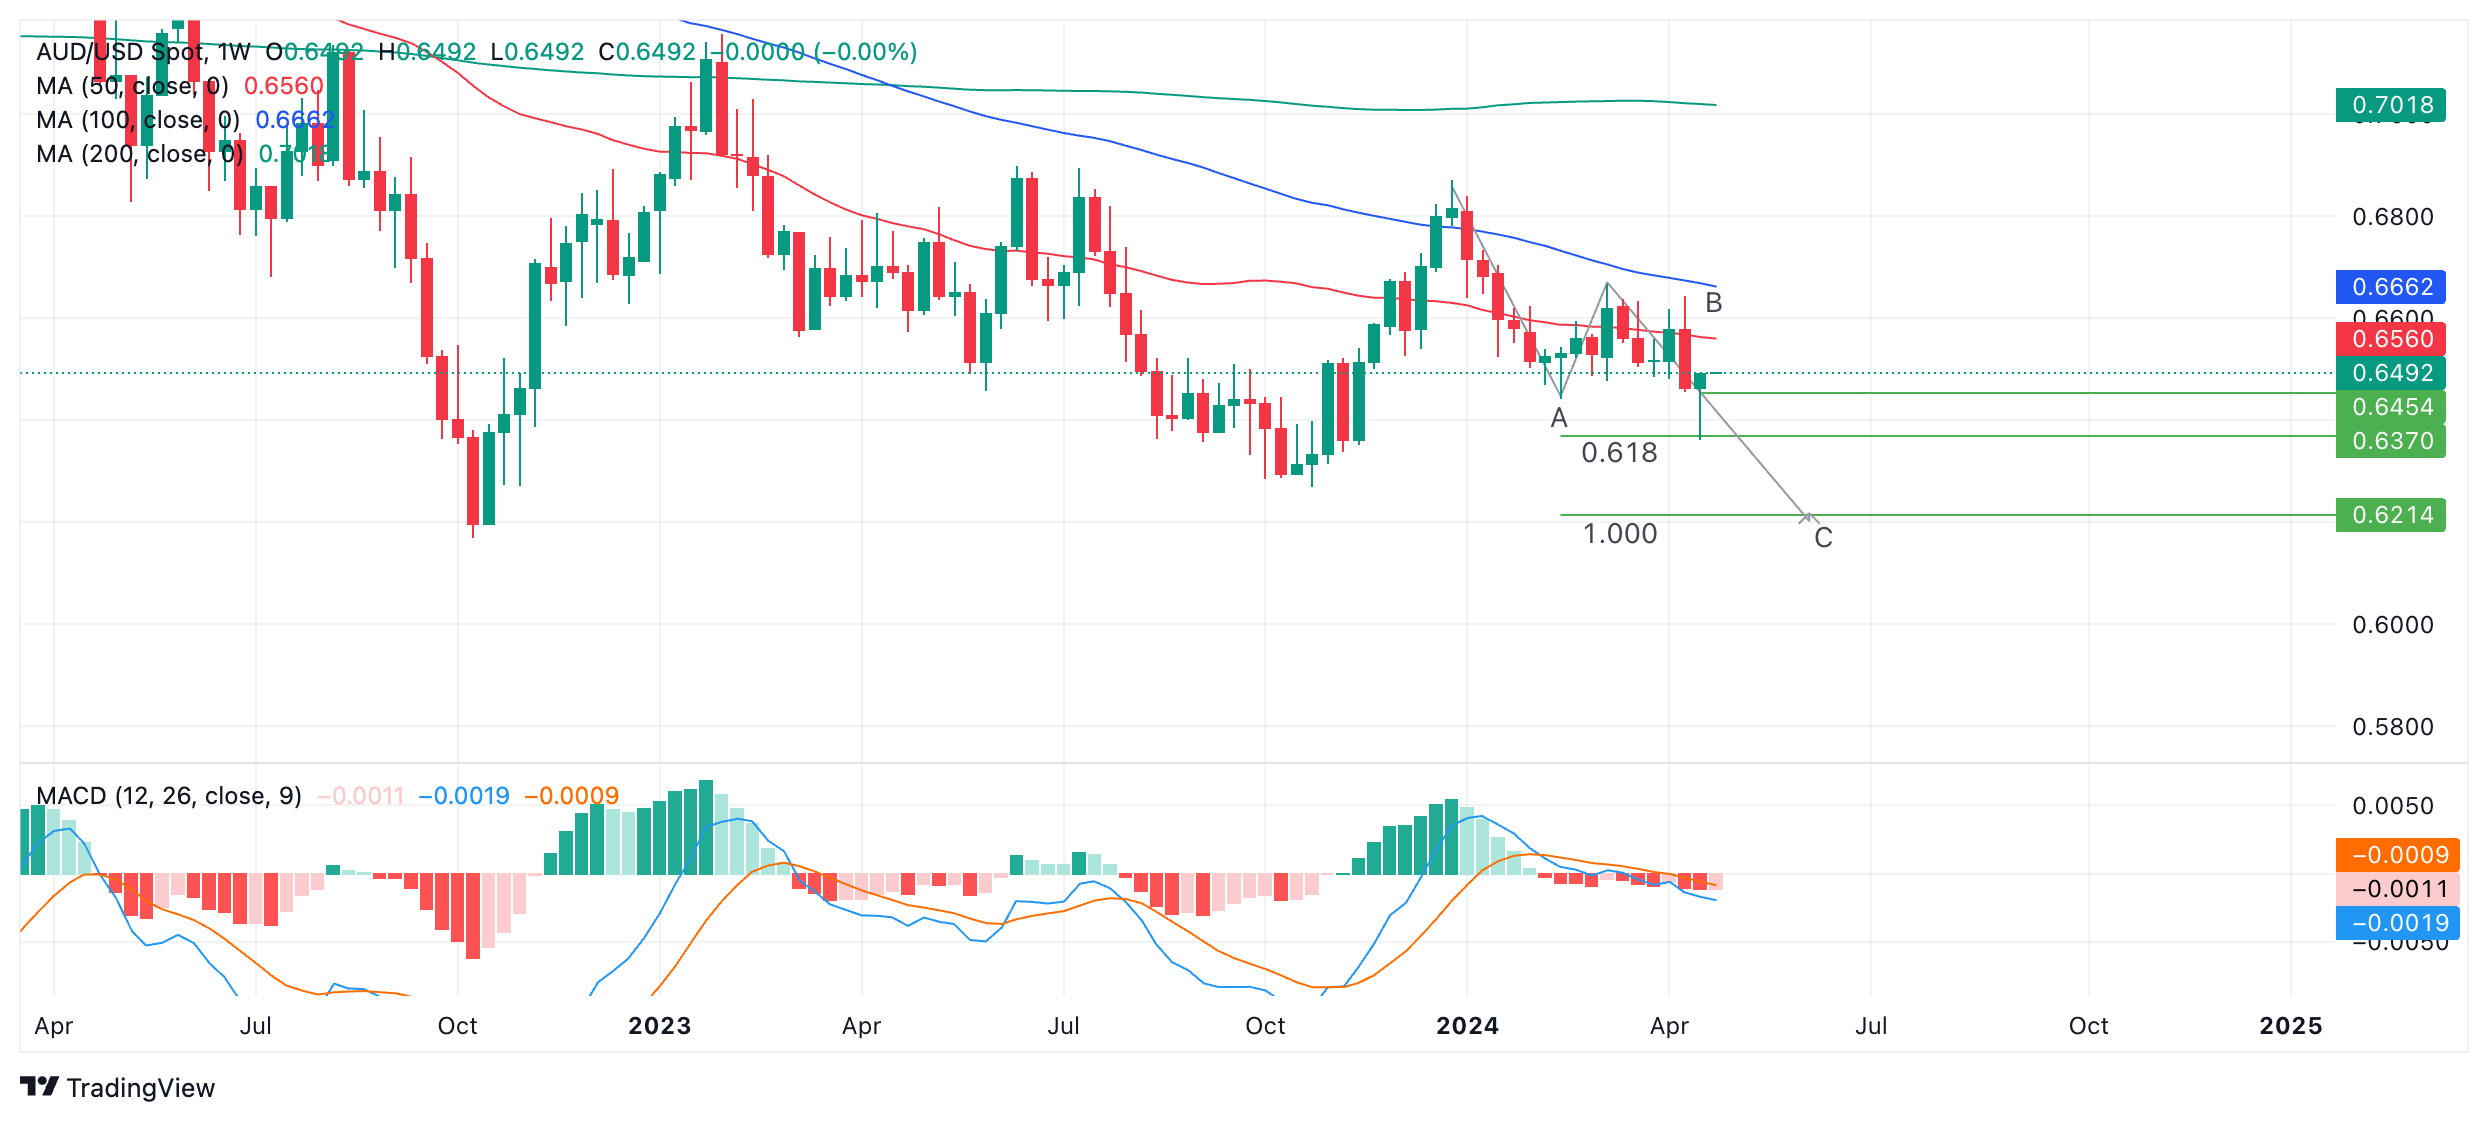
The weekly chart is the least-bullish looking chart of the three.
AUD/USD looks like it is probably forming a bearish three-wave Measured Move pattern, with waves labeled A, B and C.
If this is the case, the pair looks to be in the middle of the C-wave. Once C is complete, price is likely to undergo a reversal or, at least, a correction.
Wave C is normally equal to the length of wave A or more conservatively a Fibonacci 0.618 ratio of A. If the latter is the case, wave C may have already completed. This would add weight to the bullish reversal thesis.
If not, wave C probably has further to fall. Whilst finding out whether the current week ends on a bearish or bullish note will be crucial to interpreting the chart, simply going by the patterning, it seems risk of more downside is still very much alive.
Forex News
Keep up with the financial markets, know what's happening and what is affecting the markets with our latest market updates. Analyze market movers, trends and build your trading strategies accordingly.


