GBP/USD Price Analysis: Poised to resume downtrend, despite ‘morning star’ formation
- GBP/USD dips slightly as higher US Treasury yields bolster the US Dollar, following upbeat US data.
- Technical analysis shows GBP/USD at a pivotal point, with the potential to rise toward 1.2500 if it breaks past the April 23 high of 1.2458.
- Key downside risks include a retreat to 1.2400 and possibly further to the April 22 low of 1.2299 if current resistance holds firm.
The Pound Sterling is experiencing slight losses against the US Dollar, largely due to the influence of high US Treasury yields that are bolstering the Greenback. This trend was fueled by the release of economic data, which showed that Durable Goods exceeded expectations, leading to a surge in US yields and a favorable environment for the USD. The GBP/USD is currently trading at 1.2444, reflecting a 0.04% decrease.
GBP/USD Price Analysis: Technical outlook
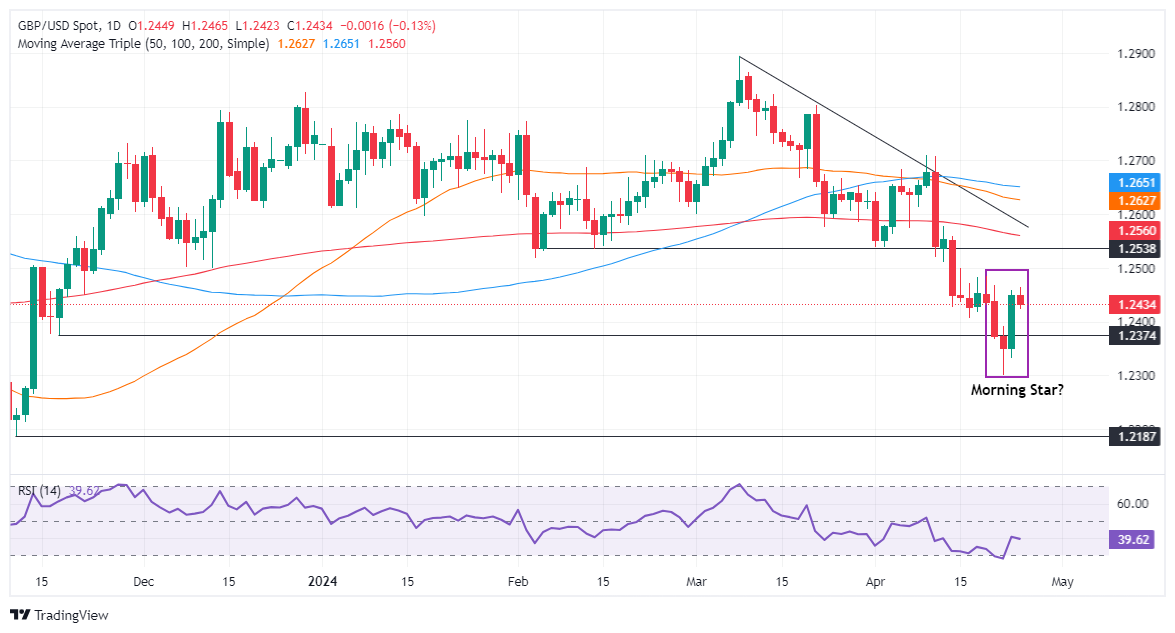
After forming a ‘morning star,’ the GBP/USD is set to continue to print gains, but traders must decisively clear the April 23 high at 1.2458, which would pave the way toward 1.2500. Up next, the first crucial resistance level would be the 200-day moving average (DMA) at 1.2561, followed by 1.2600.
On the other hand, if GBP/USD remains constrained by the April 23 high, that could pave the way for a retracement to 1.2400. A decisive break would expose April 22 low at 1.2299, which, once surpassed, could open the door to test an upslope support trendline drawn from March 2023 lows that pass at around 1.2250/60.
GBP/USD Price Action – Daily Chart
Forex News
Keep up with the financial markets, know what's happening and what is affecting the markets with our latest market updates. Analyze market movers, trends and build your trading strategies accordingly.


