WTI holds gains near $80.00 on upbeat Oil demand outlook
- The Oil price remains firm near $80.00 as expectations for the Fed reduce interest rates twice this year.
- Investors digested voluntary production cuts announced in the OPEC meeting.
- Summer vacation season in the Northern Hemisphere strengthens the Oil demand outlook.
West Texas Intermediate (WTI), futures on NYMEX, cling to gains near the psychological resistance of $80.00 in Tuesday’s European session. The Oil price remains firm as investors expect a substantial growth in demand due to severe heatwaves in the Northern Hemisphere amid the summer vacation season. The arrival of summer prompts the demand for energy, which is favorable for the Oil price.
The strength in the Oil price is also backed by firm speculation that the Federal Reserve (Fed) will trim interest rates twice this year. The expectations for two rate cuts were boosted by soft United States (US) Consumer Price Index (CPI) report for May, which indicated that progress in inflation declining towards the 2% target has resumed. Growing speculation for Fed rate cuts pleases the Oil price outlook as policy expansion spurts growth.
In today’s session, investors will focus on the monthly US Retail Sales data for May, which will be published at 2:30 GMT. The Retail Sales data is estimated to have grown by 0.2% after remaining flat in April.
Meanwhile, investors have also shrugged off voluntary cuts in overall oil production by communicated by OPEC+ members after their meeting in the first week of June.
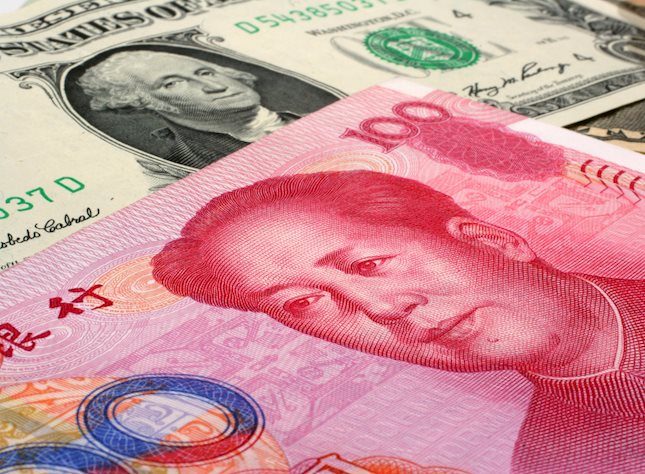
The Oil price remains firm even though China’s economic data for May missed estimates. In May, the House Price Index deflated by 3.9%, and Industrial Production and YTD Fixed Asset Investment grew slower than expected by 5.6% and 4%, respectively. However, Retail Sales rose by 3.7%, beating expectations of 3% and the prior release of 2.3%. It is worth noting that China is the world’s largest importer of Oil, and its weak economic health impacts the Oil demand outlook.
Forex News
Keep up with the financial markets, know what's happening and what is affecting the markets with our latest market updates. Analyze market movers, trends and build your trading strategies accordingly.