
AUD/JPY Price Analysis: Bulls ran out of steam and bears claim ground
- The daily RSI suggests consistent buying momentum, with a slight dip indicating the possibility of a short-term correction.
- The hourly RSI and MACD readings suggest mounting selling pressure in recent transactions.
The AUD/JPY trades at 102.43, demonstrating a pronounced bullish inclination despite Monday’s sharp losses. Indicators took a big hit and suggests that despite the bullish command, sellers are gaining ground.
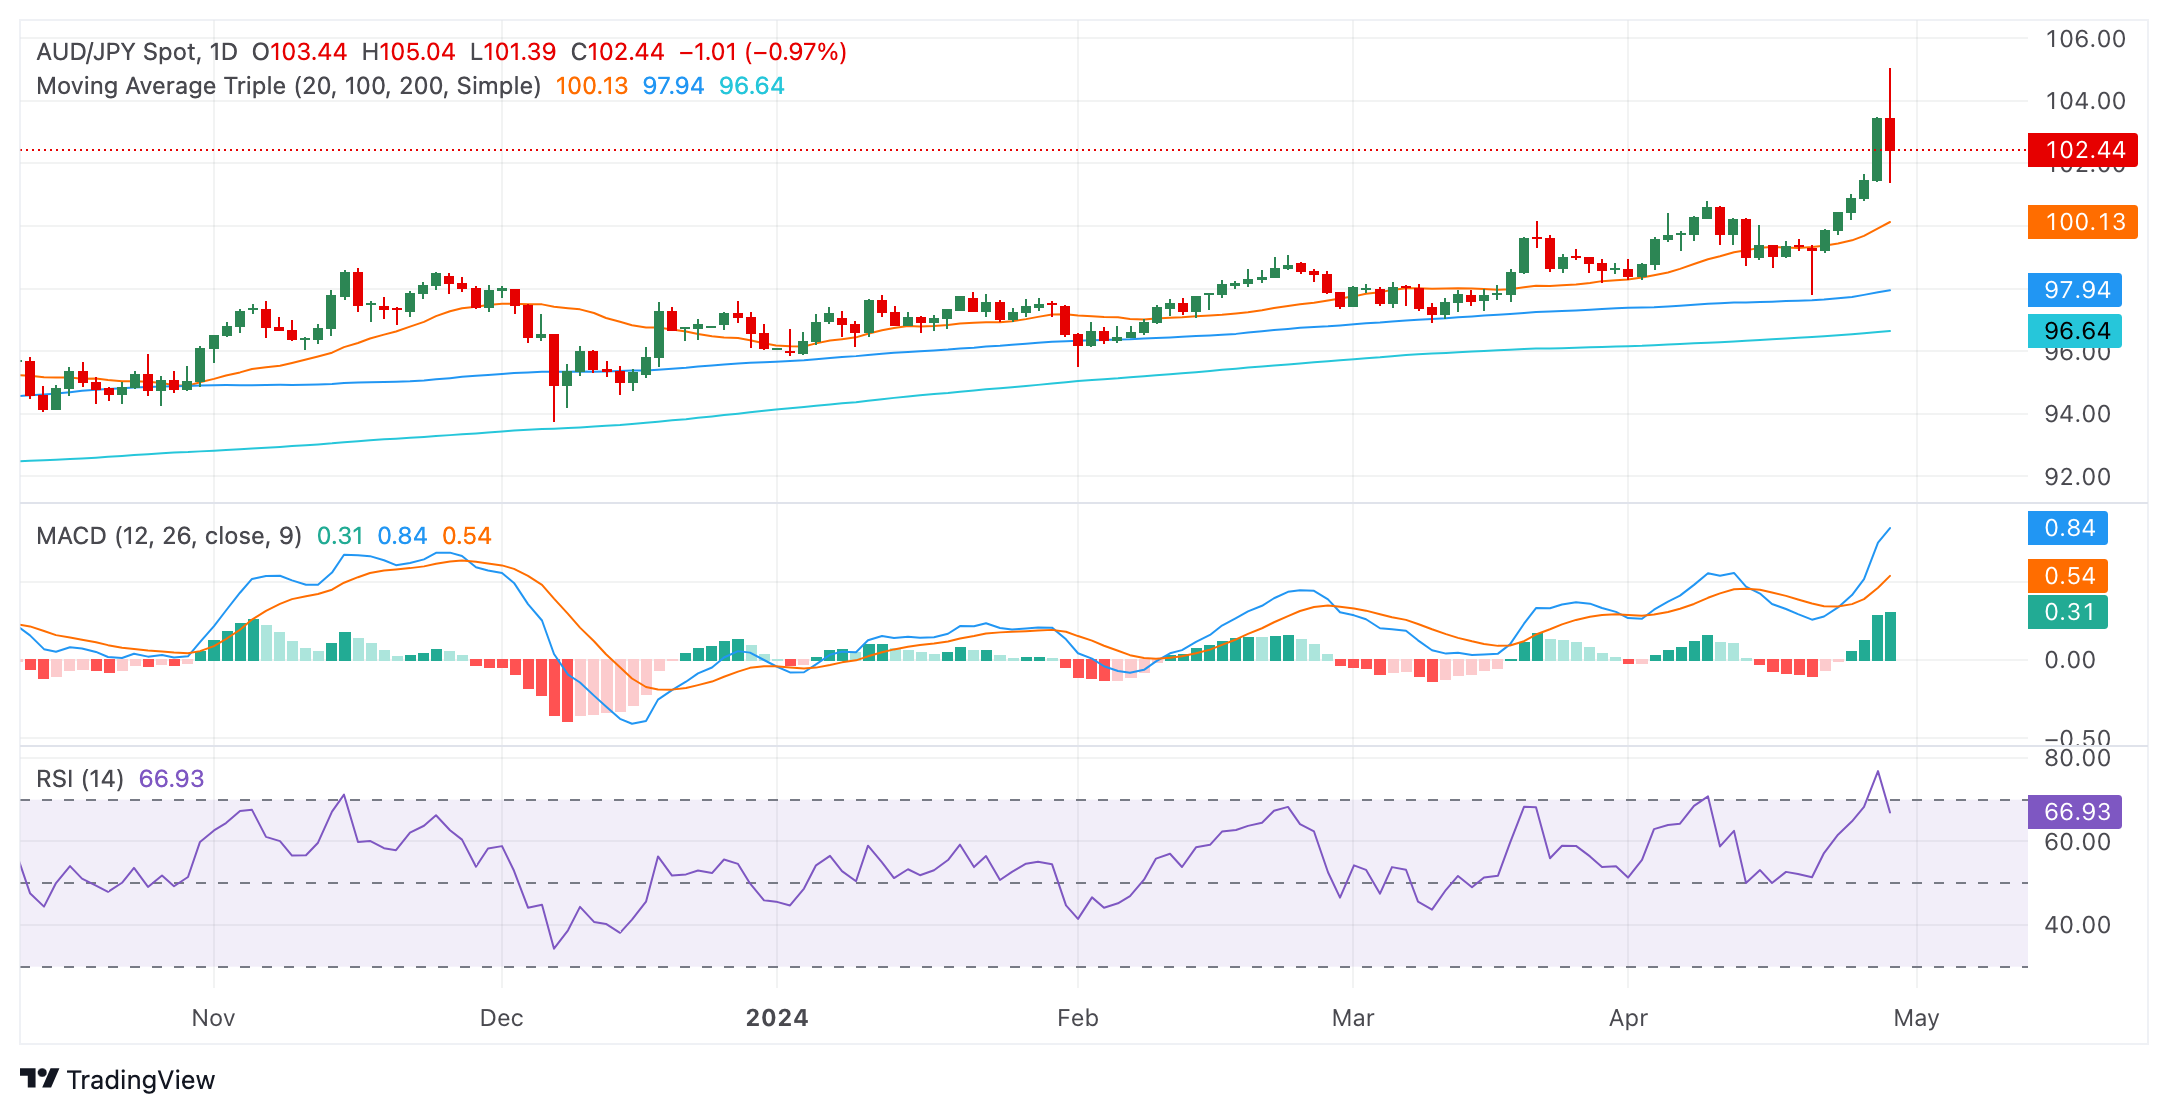
On the daily chart, the Relative Strength Index (RSI) is seen trending within the overbought terrain, suggesting that buying activity has dominated the market action. A recent dip from overbought territory to 66 indicates potential for a short-term correction in the upcoming sessions. Meanwhile, the Moving Average Convergence Divergence (MACD) maintains flat green bars, signifying stable positive momentum.
AUD/JPY daily chart
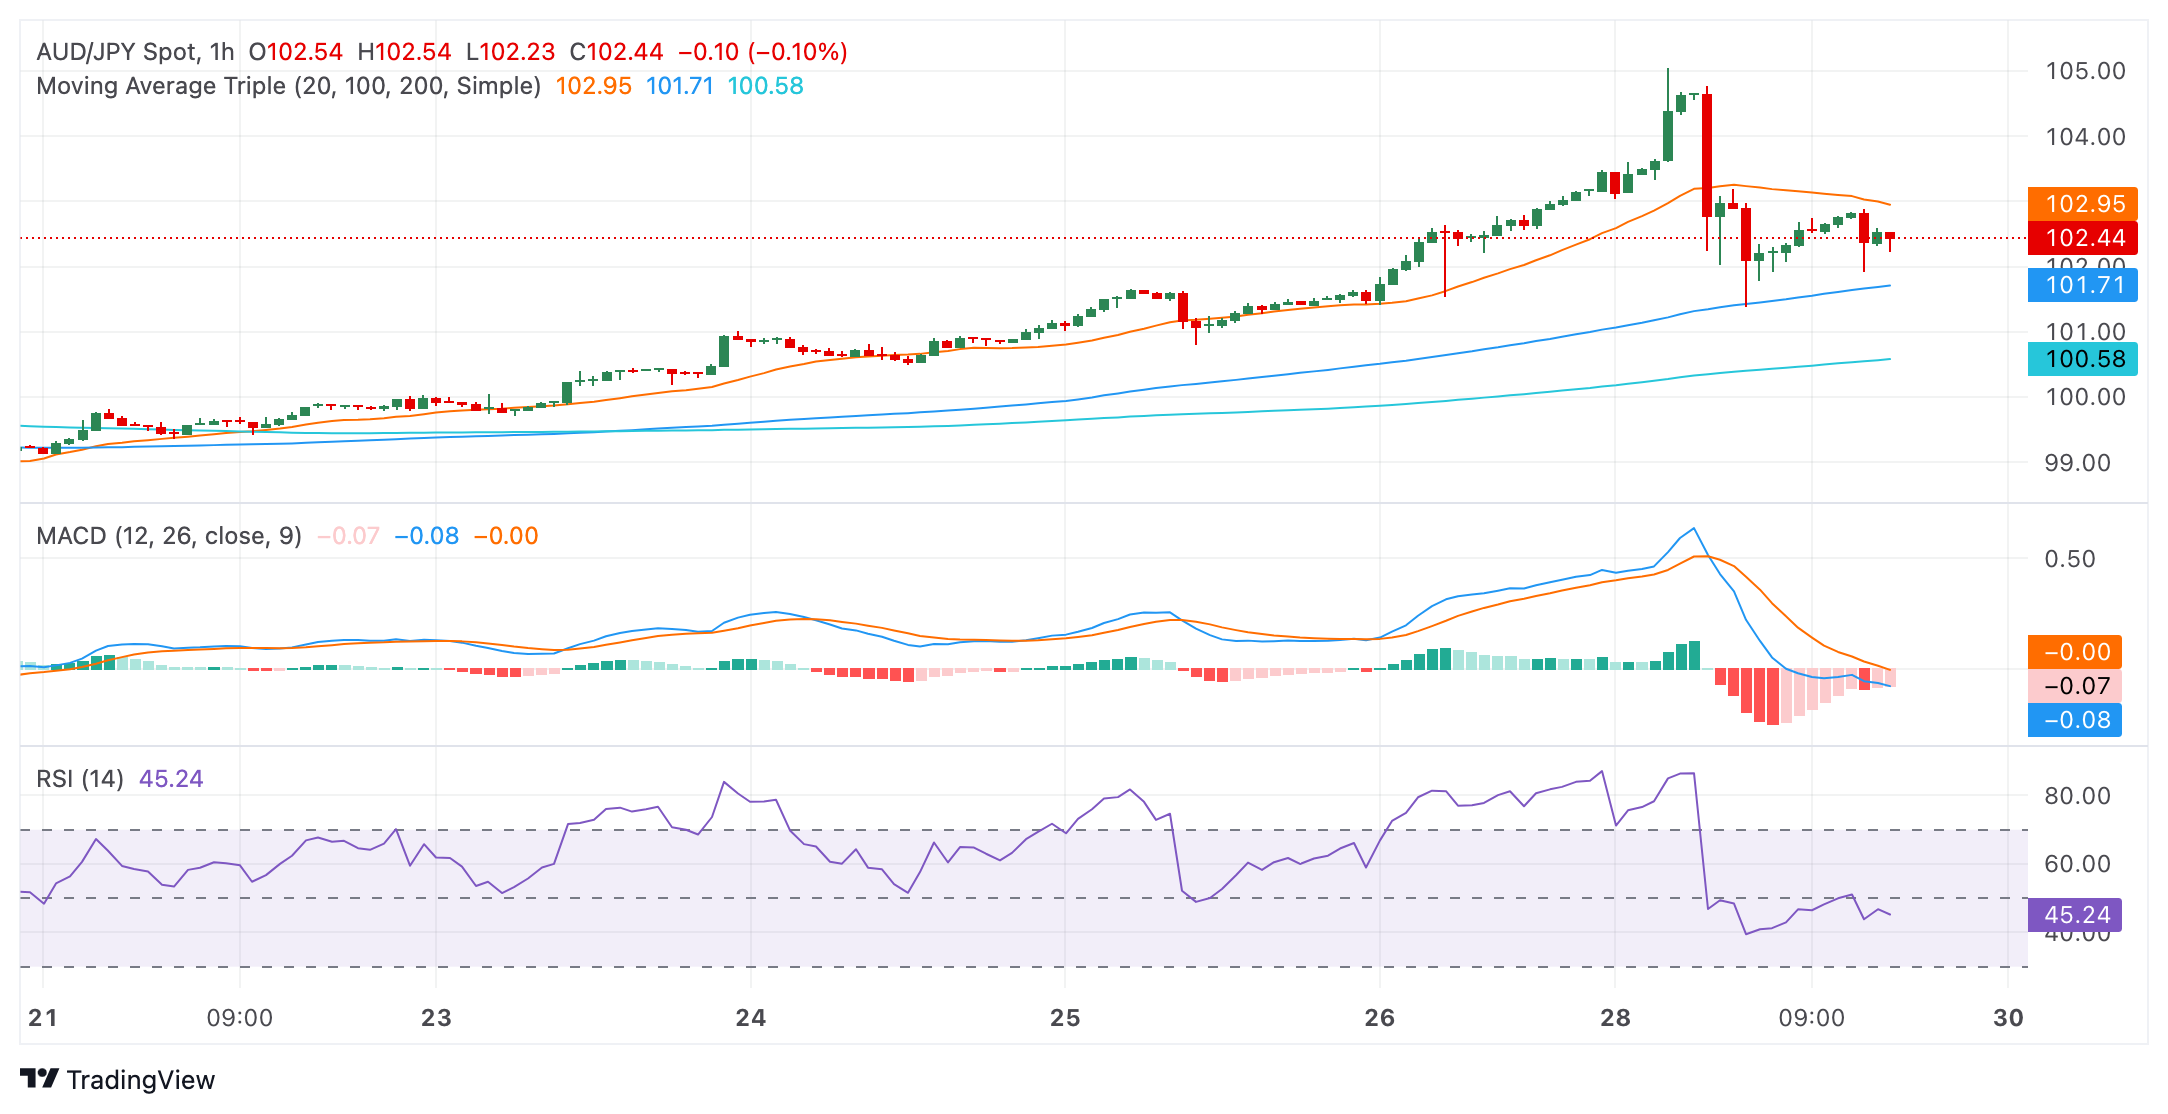
Shifting to the hourly chart, the RSI readings reveal a contrasting scenario. The hourly RSI readings are trending in the negative territory, demonstrating that selling activity had a certain control in the latest trading hours. Moreover, the hourly MACD marks flat red bars, underlining a steady negative momentum.
AUD/JPY hourly chart
Observing the broader perspective, the AUD/JPY currently occupies a position above the 20, 100, and 200-day SMA. This stance underscores the prevailing bullish market sentiment in both short-term and long-term scenarios. In conclusion, while the daily indicators reflect an overall bullish sentiment, recent hourly readings suggest the potential for a short-term correction. Traders should monitor these contrasting signals closely as there might be a shift in the momentum in favor of the sellers and they might reclaim the 20-day SMA.
Forex News
Keep up with the financial markets, know what's happening and what is affecting the markets with our latest market updates. Analyze market movers, trends and build your trading strategies accordingly.