Silver Price Forecast: XAG/USD finds support near $27 as US Dollar edges down ahead of US data
- Silver price bounces back as US Dollar drops ahead of US Q1 GDP data.
- Weak S&P Global US preliminary PMI report for April casts doubts over the UK’s economic outlook.
- The US core PCE inflation data will significantly influence the Fed’s interest rate outlook.
Silver Price (XAG/USD) finds interim support near $27 in Thursday’s European session after facing a sharp sell-off in the past week. The white metal discovers some buying interest as the US Dollar edges down.
The US Dollar Index (DXY) corrects to near 105.60 after the S&P Global United States preliminary PMI for April reported that the inflow of new business fell for the first time in six months, which raised doubts over a strong economic outlook. However, the broader-term outlook of the US Dollar has not faded yet as Federal Reserve (Fed) policymakers have been emphasizing maintaining the current policy framework for a longer period, considering strong labour demand and stubbornly higher inflation data.
Going forward, the US Dollar will be tested on the grounds of Q1 preliminary Gross Domestic Product (GDP) data, which will be published at 12:30 GMT. The US economy is estimated to have expanded by 2.5%, at a slower pace than the 3.5% growth recorded in the last quarter of 2023. A strong US GDP data would improve speculation for a soft landing by the Fed. The soft landing is a situation in which the central bank achieves price stability without triggering a recession.
10-year US Treasury yields trade close to 4.65% exhibiting consolidation ahead of the US core Personal Consumption Expenditure Price Index (PCE) data for March, which will be published on Friday. The underlying inflation data will significantly influence market expectations about when the Fed will start reducing interest rates. Higher bond yields negatively impact the appeal of non-yielding assets, such as Silver, by increasing the cost of holding an investment in it.
Silver technical analysis
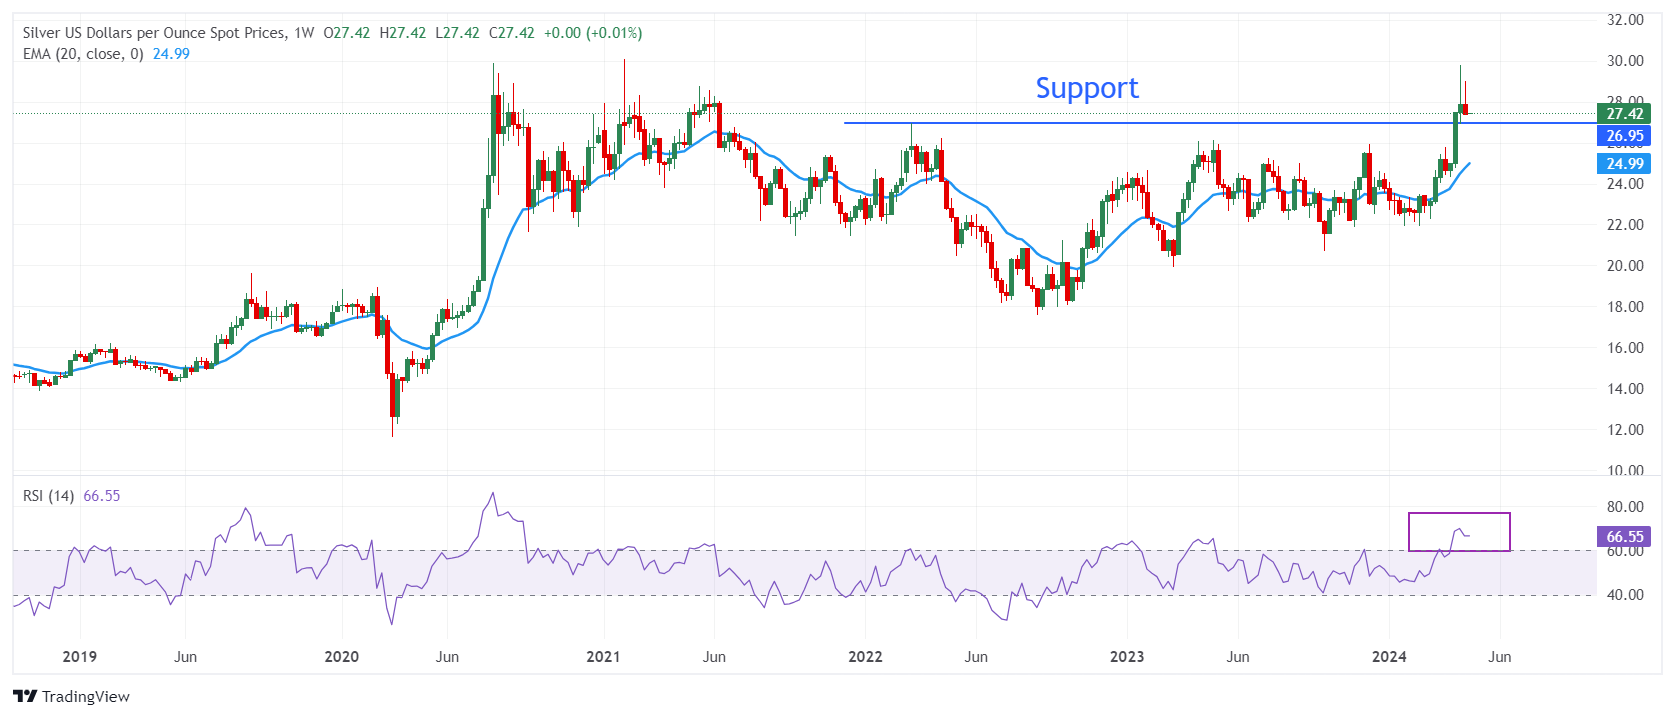
Silver price corrects to near March 2022 high near $27.00 after failing to extend upside above the crucial resistance of $30.00. The near-term appeal for Silver remains strong as the 20-week Exponential Moving Average (EMA) at $25.00 is sloping higher.
The 14-period Relative Strength Index (RSI) oscillates in the bullish range of 60.00-80.00, suggesting a firm bullish momentum.
Silver weekly chart
Forex News
Keep up with the financial markets, know what's happening and what is affecting the markets with our latest market updates. Analyze market movers, trends and build your trading strategies accordingly.


