
EUR/USD down sharply after US GDP data
- EUR/USD falls sharply after the release of US Q1 GDP data.
- The data shows a lower-than-expected growth rate but accompanying inflation data rises, supporting the USD.
- The short-term trend could now be bullish on the 4-hour chart.
EUR/USD falls sharply on Thursday after the release of US Gross Domestic Product (GDP) data for the first quarter. EUR/USD fell three-tenths of a percent just after the release, breaking back below the key 1.0700 level. Since then it has rallied and moved back above 1.0700 but remains well below the high of the day.
EUR/USD plummets after US GDP data
EUR/USD fell after the release of US GDP data on Thursday. US preliminary Gross Domestic Product Annualized rose 1.7% in Q1 which was below estimates of 2.5% and the previous quarter's 3.4% reading, according to data from the US Bureau of Economic Analysis.
EUR/USD declined after the data, however, after a guage of inflation within the GDP data – the preliminary Gross Domestic Product Price Index for Q1 – came out at 3.1% which was substantially higher than the 1.7% of the previous quarter. This suggests stubbornly high inflation in the US economy that will lead the Federal Reserve (Fed) to keep interest rates higher for longer. Higher interest rates are in turn positive for USD since they attract great inflows of foreign capital. According to the CME's FedWatch Tool, which gauges the probability of future interest rate changes, the probabilities now favor a first cut in September, by about a 58.2% probability.
In addition, higher-than-expected Core Personal Consumption Expenditures in Q1, which is also a measure of inflation, showed a 3.7% rise QoQ compared to estimates of 3.4% and a previous reading of 2.0%.
Other data that impacts the USD has also been released on Thursday, including Initial Jobless Claims, which fell to 207K from 212K previously and 214K forecast, and Pending Home Sales in the US, which showed an rise to 3.4% MoM in March, eclipsing expectations of 0.3% and the previous month's 1.6%.
EUR/USD temporarily recovered midweek after mixed US data
EUR/USD recovered on Tuesday after preliminary US PMI data for April showed an unexpected cooling in business activity, suggesting the economy was beginning to feel the burden of higher interest rates.
On Wednesday, the US Census Bureau revealed that Durable Goods Orders in the United States increased 2.6% MoM in March, up from a 0.7% rise previously, and beating estimates of 2.5%. Core goods, which exclude transportation, increased by 0.2% MoM, an improvement over February's 0.1% increase, but short of the 0.3% projected.
Whilst the Durable Goods data was positive, it failed to move USD. This could be because it is viewed as a volatile series or, as some now think, because a lot is already priced into the Dollar, making it less sensitive to positive data.
“A lot is already priced into the Dollar” – Commerzbank
The US Dollar has priced in a lot, in particular the acute shift in market expectations regarding the future course of interest rates, according to Analysts at Commerzbank.
Since the Federal Reserve’s (Fed) March meeting markets have consistently pushed back the date by when the Fed is likely to begin cutting interest rates – higher interest rates attract more foreign capital inflows and are thus positive for the US Dollar.
This recalibration of the future path of interest rates has now been fully priced in, according to Antje Praefcke, FX Analyst at Commerzbank, and in the absence of more catalysts, makes USD more vulnerable to “bad news” than “good news”.
“In my opinion, the market's reaction (USD falling this week) shows that a lot is already priced into the Dollar, such as a soft landing of the economy or a Fed that will only cut the key interest rate much later than previously thought,” says Praefcke.
The US Dollar having “priced in a lot” is why it reacted more to the poor US PMI data on Tuesday than the positive US Durable Goods Order data on Wednesday.
“It is becoming increasingly difficult for the Dollar to benefit from facts and figures that underpin this expectation (a delay in future rate cuts); on the contrary, it tends to react sensitively when the market has doubts about its current expectation in the face of not-so-good data. The Dollar is gradually running out of steam, although it is currently the undisputed most popular currency and is likely to remain so,” adds the Analyst.
EUR/USD rises due to services-sector effect
The Euro (EUR), meanwhile, stabilized after strong Services PMI data stoked services-sector inflation expectations. This has been interpreted as potentially reigning in the European Central Bank (ECB) as it forges ahead with cutting interest rates.
Although a June rate cut is probably still a “fait accomplis”, according to Luis de Guindos, the Vice President of the ECB, his colleague at the ECB, Bundesbank President Joachim Nagel was more cautious on Wednesday.
Nagel said, “Services inflation remains high, driven by continued strong wage growth,” and until inflation fell in a sustainable manner he could not “pre-commit to a particular rate path.”
Hi views were echoed by European Central Bank (ECB) executive board member Isabel Schnabel and ECB Policymaker Madis Muller on Thrusday, with Schnabel highlighting persistent services-sector inflation and Muller saying she was not comfortable committing to "back-to-back cuts."
Technical Analysis: EUR/USD breaks out of short-term range
EUR/USD has broken out of the rectangular range it was trading in on the 4-hour chart by piercing above the ceiling at 1.0700.
It is now less certain EUR/USD is forming a Bear Flag price pattern, which has become deformed by the breakout.
EUR/USD 4-hour Chart
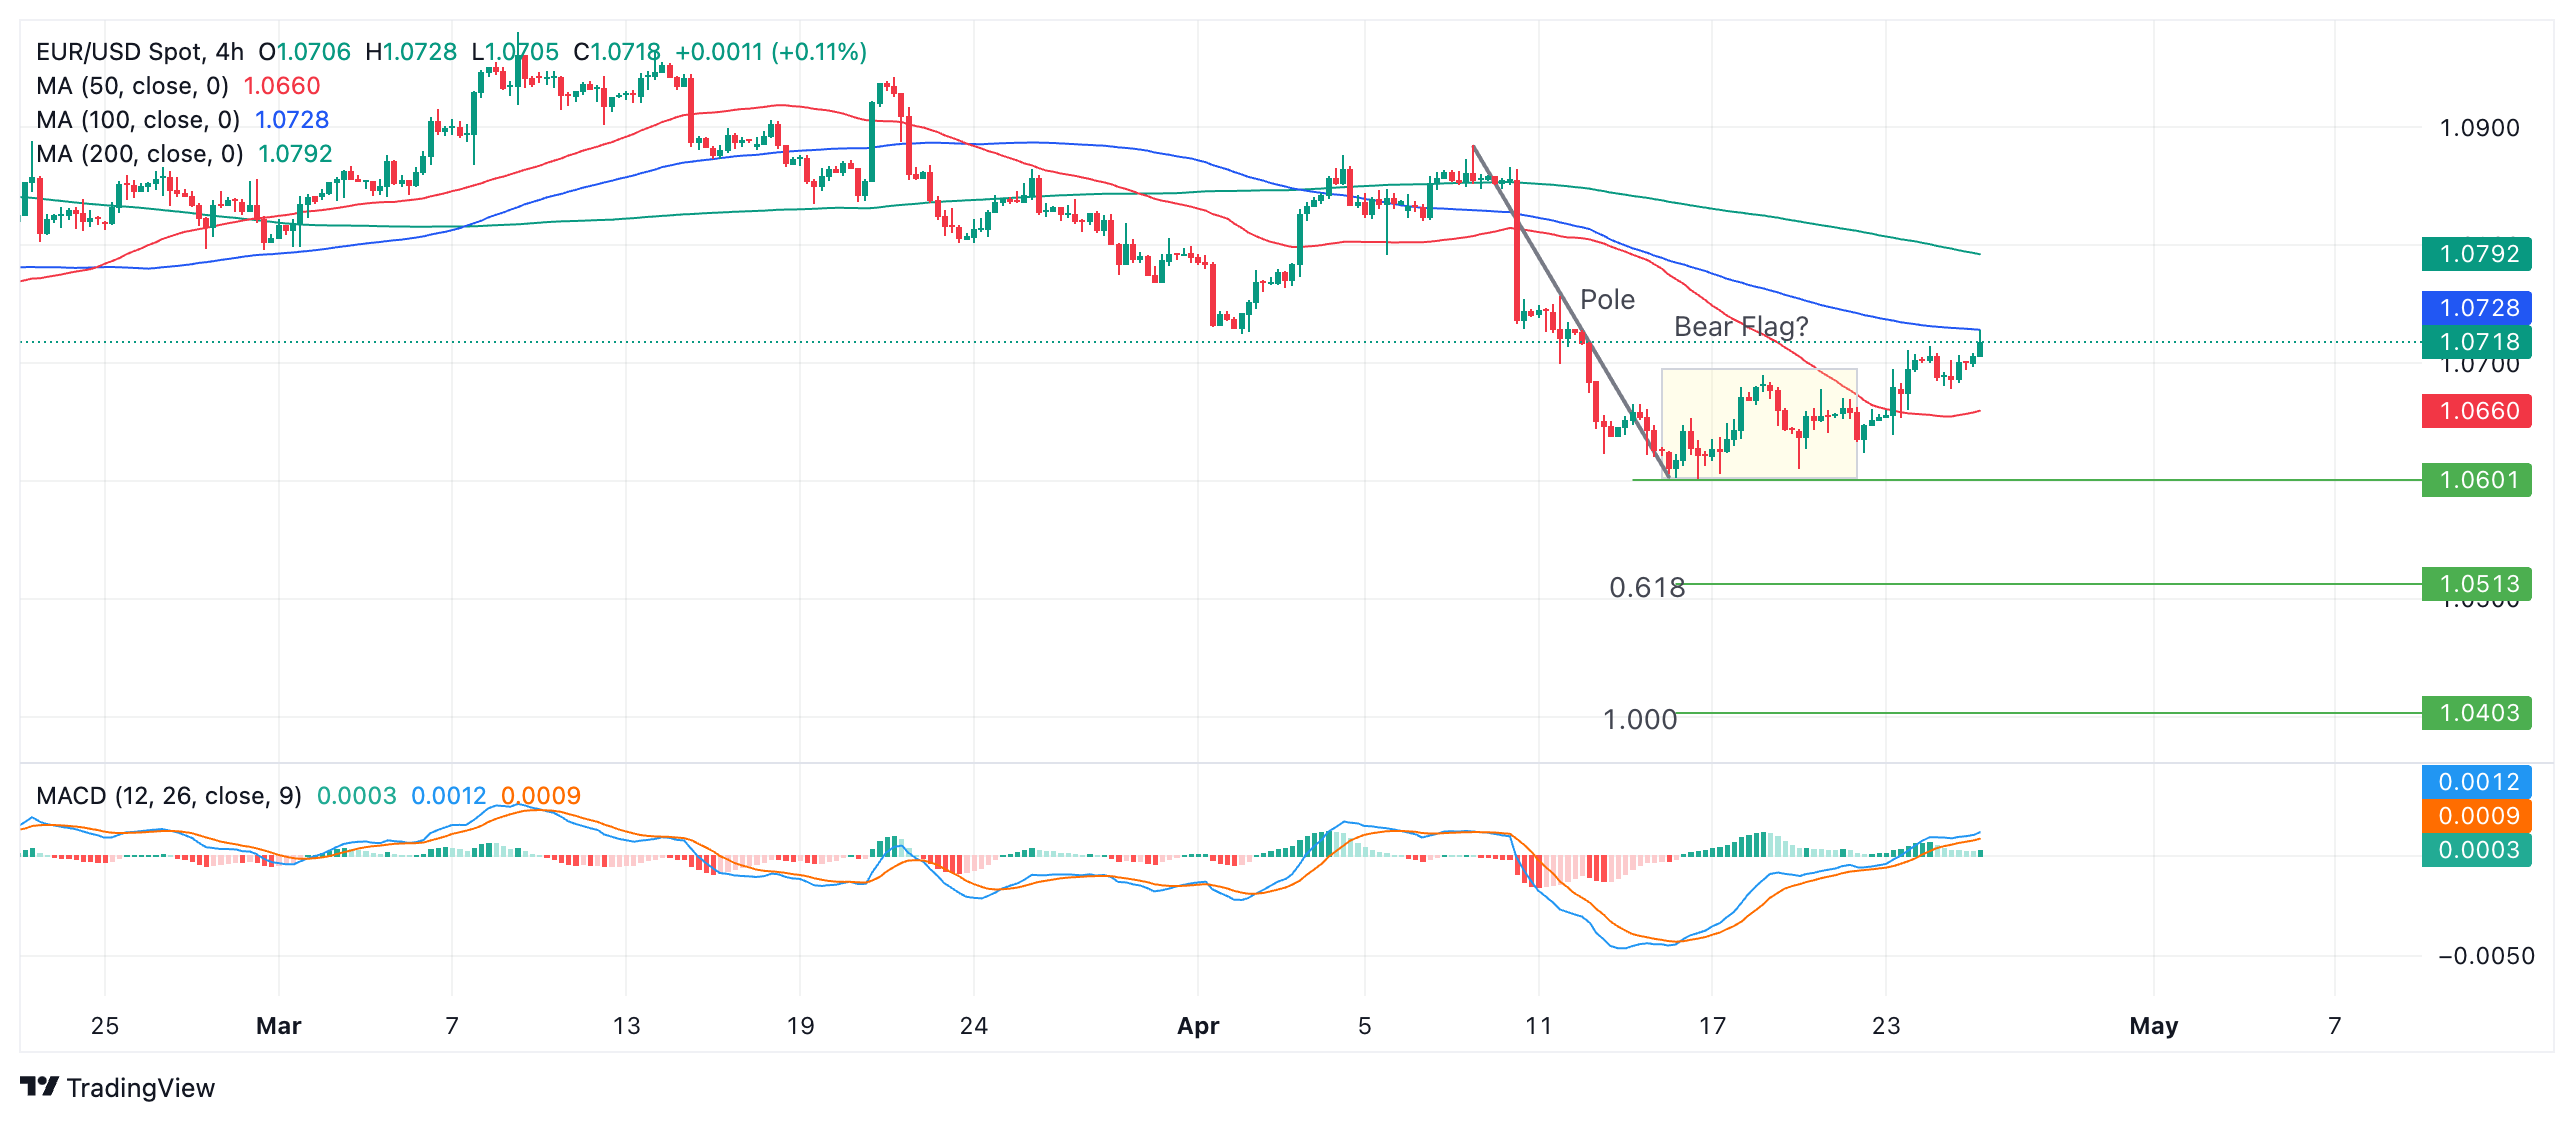
There is an argument for the short-term trend now being bullish and therefore suggestive of more gains in the pair. Resistance from a previous lower high on April 11 gives an initial target at 1.0757. Then the 50-day and 200-day Simple Moving Averages (SMA) on the daily chart (not shown) are likely to resist at 1.0807.
On the other hand a break below the 1.0601 April 16 low would revive the Bear Flag hypothesis.
According to technical lore, the expected move down from a Bear Flag equals the length of the preceding “pole” or a Fibonacci ratio of the pole.
The Fibonacci 0.618 ratio of the pole extrapolated lower gives a conservative target at 1.0503. The next concrete target is at 1.0448 – the October 2023 low. A fall of equal length to the pole would take EUR/USD to 1.0403.
Economic Indicator
Gross Domestic Product Annualized
The real Gross Domestic Product (GDP) Annualized, released quarterly by the US Bureau of Economic Analysis, measures the value of the final goods and services produced in the United States in a given period of time. Changes in GDP are the most popular indicator of the nation’s overall economic health. The data is expressed at an annualized rate, which means that the rate has been adjusted to reflect the amount GDP would have changed over a year’s time, had it continued to grow at that specific rate. Generally speaking, a high reading is seen as bullish for the US Dollar (USD), while a low reading is seen as bearish.
Read more.Last release: Thu Apr 25, 2024 12:30 (Prel)
Frequency: Quarterly
Actual: 1.6%
Consensus: 2.5%
Previous: 3.4%
Source: US Bureau of Economic Analysis
The US Bureau of Economic Analysis (BEA) releases the Gross Domestic Product (GDP) growth on an annualized basis for each quarter. After publishing the first estimate, the BEA revises the data two more times, with the third release representing the final reading. Usually, the first estimate is the main market mover and a positive surprise is seen as a USD-positive development while a disappointing print is likely to weigh on the greenback. Market participants usually dismiss the second and third releases as they are generally not significant enough to meaningfully alter the growth picture.
Forex News
Keep up with the financial markets, know what's happening and what is affecting the markets with our latest market updates. Analyze market movers, trends and build your trading strategies accordingly.


