XAG/USD Price Analysis: Extends losses toward support at $21.50 psychological level
- Silver price persists as market caution prevails regarding the Fed's interest rate trajectory.
- Momentum indicators signal a potential bearish sentiment in the price movements.
- The psychological level at $21.50 emerges as the immediate support.
Silver price continues to follow its downward trajectory, trading lower around $21.80 during the Asian session on Monday. The prices of non-yielding assets like Silver face challenges, primarily due to the upbeat US Treasury Yields. The yield on the 10-year US Treasury bond stands at 4.61%, up by 0.96% by the press time.
Furthermore, China released its Manufacturing PMI data over the weekend, indicating improvement and entering positive territory. However, this positive development did not seem to have a favorable impact on Silver prices.
Chinese NBS Manufacturing PMI for August increased to 50.2 from the previous 49.7 figures, surpassing the anticipated 50.0. Additionally, the Non-Manufacturing PMI climbed to 51.7 from the previous reading of 51.0, exceeding the market consensus of 51.5.
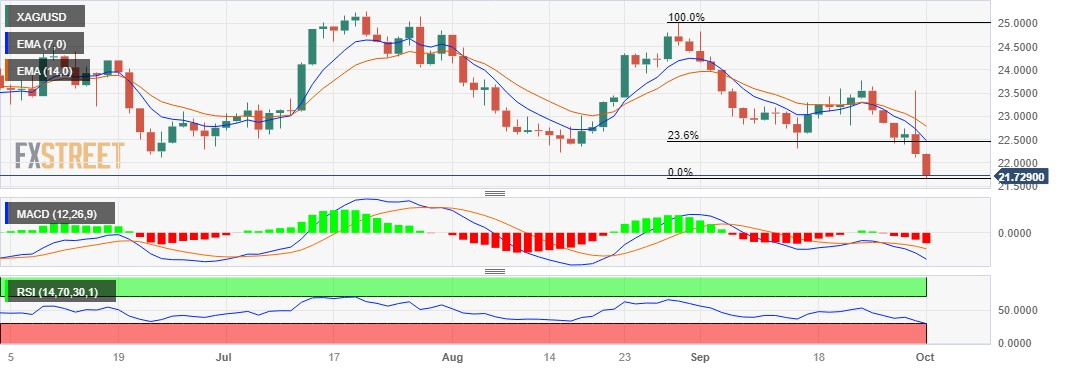
The current downward momentum in the pair appears to have a bearish bias, given that the 14-day Relative Strength Index (RSI) remains below the 50 level.
The XAG/USD pair could meet support at the $21.50 psychological level, following the $21.00 level.
On the upside, the 23.6% Fibonacci retracement at $22.46 lined up with the seven-day Exponential Moving Average (EMA) at $22.49.
A firm break above the latter could influence the XAG/USD pair to explore the area around the 14-day EMA at $22.79, followed by the $23.00 psychological level.
The Moving Average Convergence Divergence (MACD) indicator is providing a weak signal for the Silver bulls. The MACD line lies below the centerline and the signal line. This configuration suggests that there is potentially weak momentum in the XAG/USD's price movement.
XAG/USD: Daily Chart
Forex News
Keep up with the financial markets, know what's happening and what is affecting the markets with our latest market updates. Analyze market movers, trends and build your trading strategies accordingly.

