
EUR/JPY Price Analysis: Bullish run faces overbought risks, hovers around 169.00
- EUR/JPY climbs nearing the pivotal 169.00 mark, propelled by strong risk appetite and market gains.
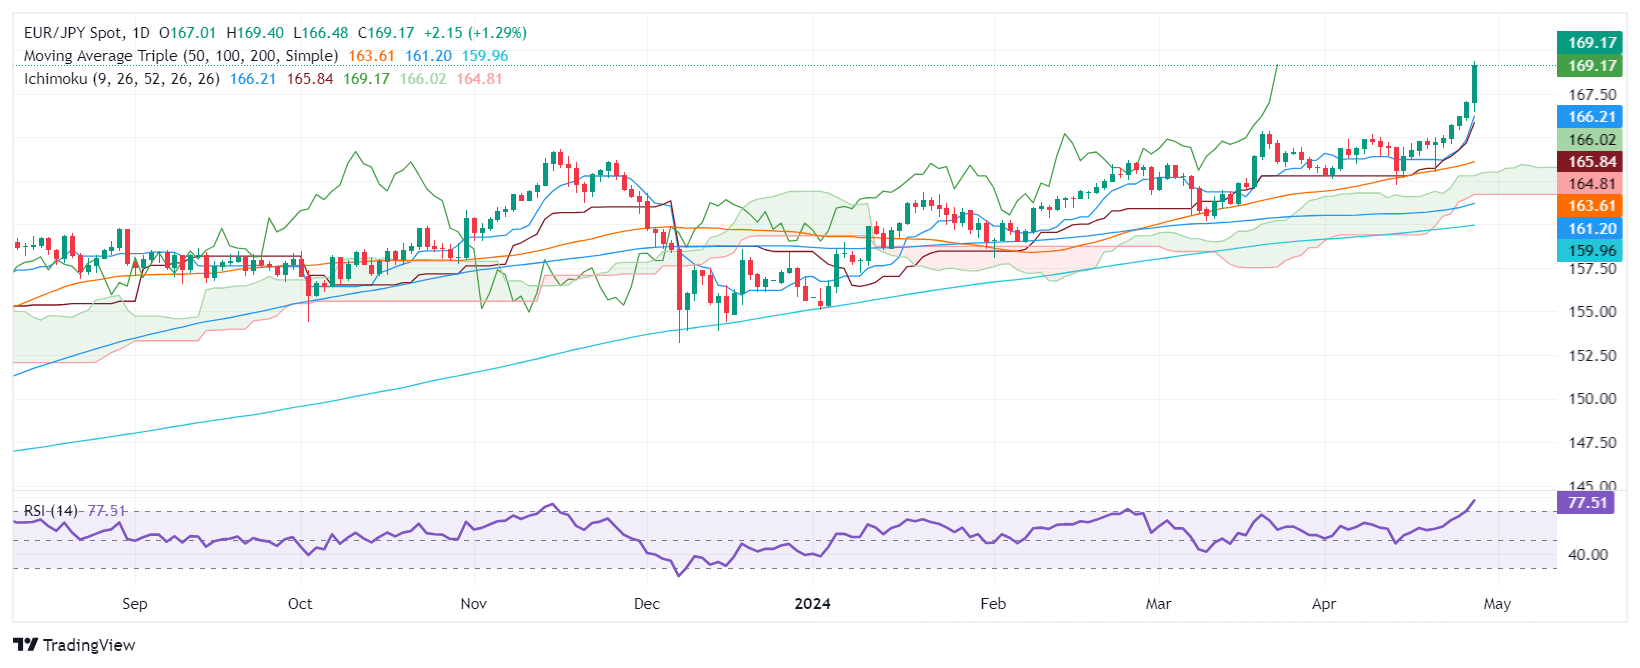
- Technical analysis shows a robust uptrend, though an RSI of 76.00 signals overbought conditions.
- If the pair surpasses 169.00, it faces resistance at the July 2008 high of 169.97, closely followed by the key 170.00 level.
- A drop below 169.00 could lead to a pullback to 168.00, further potential supports at the Tenkan-Sen at 166.20 and the Kijun-Sen at 165.84.
The EUR/JPY rallies toward the 169.00 figure yet remains shy of breaching it as risk appetite improves, as Wall Street depicts. At the time of writing, the cross-pair trades at 168.89 and is up by 1.12%.
EUR/JPY Price Analysis: Technical outlook
The daily chart depicts the EUR/JPY as upward biased, even though the rally has overextended. The Relative Strength Index (RSI) is at 76.00, usually seen as overbought, but due to the strength of the uptrend, the 80.00 level is seen as the most extreme condition.
If buyers reclaim the 169.00, the next supply zone would be the July 2008 high of 169.97. Once those two levels are cleared, the next supply zone would be 170.00.
On the flip side, a daily close below 169.00, would pave the way for a retracement to 168.00. Subsequent losses are seen below the Tenkan-Sen at 166.20, followed by the Kijun-Sen at165.84
EUR/JPY Price Action – Daily Chart
Forex News
Keep up with the financial markets, know what's happening and what is affecting the markets with our latest market updates. Analyze market movers, trends and build your trading strategies accordingly.