
USD/CHF Price Analysis: Trades close to six-month high around 0.9150
- USD/CHF oscillates near a six-month high around 0.9150, exhibiting strength ahead of crucial US data.
- The SNB is expected to extend the rate-cut cycle in June.
- The Fed sees the current interest rate policy framework as appropriate.
The USD/CHF pair hovers around the six-month high of 0.9150 in Wednesday’s early American session. The near-term outlook of the Swiss Franc asset remains bullish, with expectations of further escalation in policy divergence between the Federal Reserve (Fed) and the Swiss National Bank (SNB).
The Fed is expected to keep interest rates at their current levels for a longer period, given the strength in the United States labor market and stubbornly higher inflation due to strong consumer spending.
The SNB will reduce interest rates again in the June policy meeting. The SNB kicked off the global rate-cut cycle after lowering borrowing rates by 25 basis points (bps) to 1.5% in the March meeting. The inflation in the Swiss economy has softened below the 2% target from a longer period, allowing the SNB to slice key interest rates further.
Meanwhile, investors await the crucial US Q1 Gross Domestic Product (GDP) and the core Personal Consumption Expenditure Price Index (PCE) data for March, which will be published on Thursday and Friday. The economic data will impact market expectations for Fed rate cuts, which are currently expected in the September meeting.
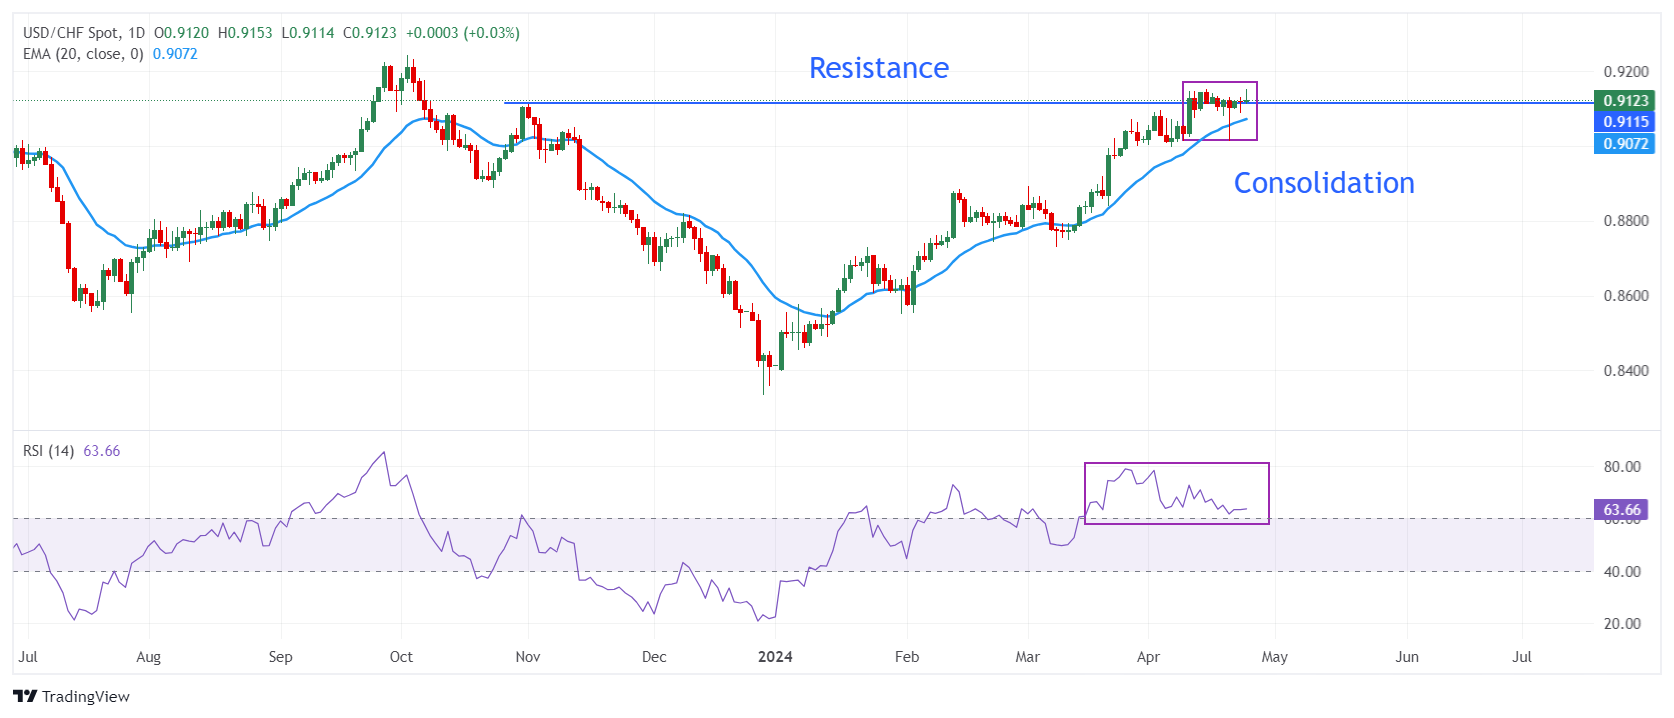
USD/CHF trades back-and-forth in a tight range near the crucial resistance of 0.9110, which is plotted from 1 November 2023 high plotted on a daily timeframe. The asset is expected to extend its upside as the upward-sloping 20-day Exponential Moving Average (EMA) near 0.9075 suggests an upbeat near-term outlook.
The 14-period Relative Strength Index (RSI) oscillates in the bullish range of 60.00-80.00, indicating that a bullish momentum is still active.
Going forward, an upside move above intraday high of 0.9153 will drive the asset towards the round-level support of 0.9200. A breach of the latter will push the asset further to 4 October 2023 high at 0.9232.
In an alternate scenario, fresh downside would appear if the asset breaks below the psychological support of 0.9000, which will expose it to March 22 low at 0.8966, followed by March 1 high at 0.8893.
USD/CHF daily chart
Forex News
Keep up with the financial markets, know what's happening and what is affecting the markets with our latest market updates. Analyze market movers, trends and build your trading strategies accordingly.


