
Pablo Piovano
29 Nov @ 02:41 (GMT+0)
USD Index Price Analysis: The 200-day SMA holds the downside so far
- The index struggles to continue the rebound around 106.70.
- The dollar keeps the positive outlook above the 200-day SMA.
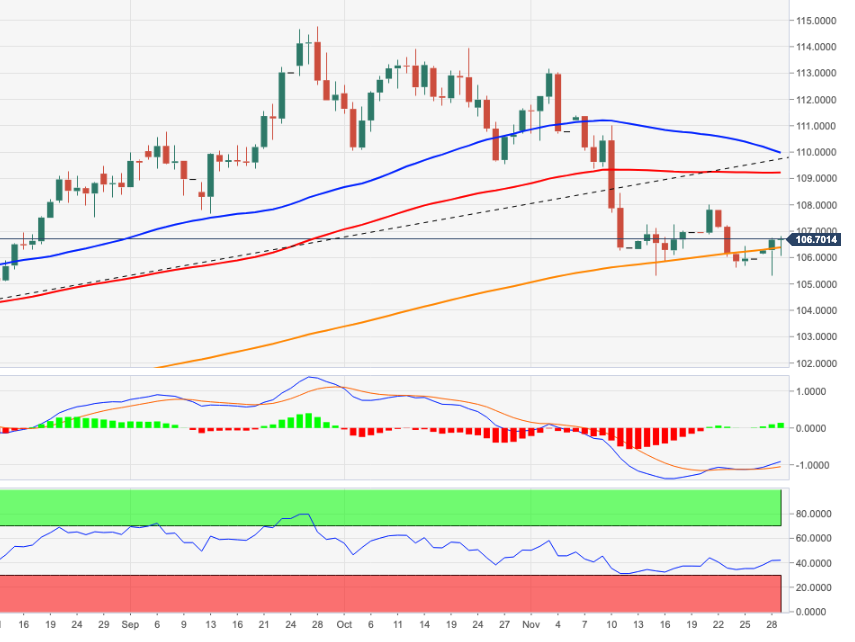
DXY reverses the initial downside and looks to extend the move further north of the 106.00 mark on Tuesday.
In case the recovery becomes more serious, then the US Dollar could attempt to retest the weekly high at 107.99 (November 21) ahead of the temporary 100-day Simple Moving Average (SMA), today at 109.12.
While above the 200-day SMA, the outlook for the index should remain positive.
DXY daily chart
Forex News
Keep up with the financial markets, know what's happening and what is affecting the markets with our latest market updates. Analyze market movers, trends and build your trading strategies accordingly.