GBP/USD consolidates its gains above 1.2550, investors await Fed rate decision
- GBP/USD takes a breather around 1.2560 in Tuesday’s early Asian session.
- The US Fed is expected to hold rates steady at its May meeting on Wednesday.
- Investors reduce their bets on BoE rate cuts, which support the Cable.
The GBP/USD pair consolidates its gains near 1.2560 after flirting with the key 200-day SMA and three-week highs in the 1.2550-1.2560 zone during the early Asian session on Tuesday. The recovery of the major pair is supported by a falling US Dollar Index (DXY) to 105.65. On Wednesday, the Federal Open Market Committee's (FOMC) interest rate decision will take center stage ahead of the release of April’s Nonfarm Payrolls (NFP) on Friday.
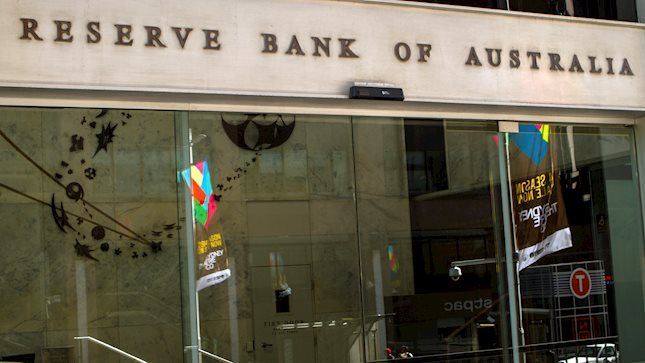
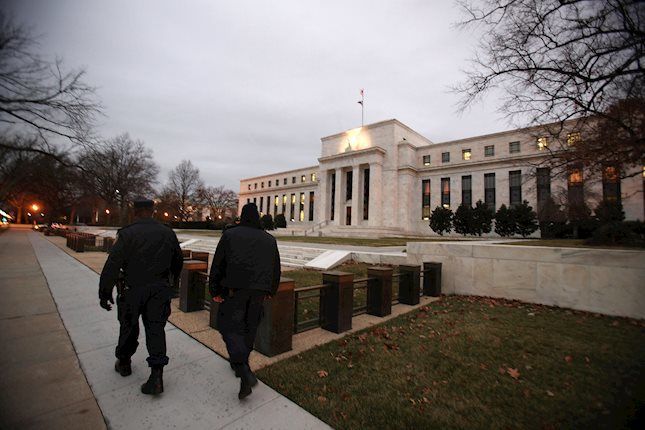
The US Federal Reserve (Fed) is widely anticipated to hold rates steady at a more than two-decade high after their meeting on Wednesday. Investors will take more cues from the tone of the meeting and Chair Jerome Powell’s press conference. Financial markets expect only one Fed rate cut in 2024, below the roughly six quarter-point cuts they expected at the beginning of the year.
The recent US GDP growth numbers and hotter-than-expected inflation data might convince the Fed to hold the rate higher for longer to become confident inflation is moving toward the central bank’s 2% target. The hawkish stance of the Fed might lift the Greenback and cap the upside of the GBP/USD pair in the near term.
On the other hand, the Pound Sterling (GBP) gains traction amid mixed guidance from Bank of England (BoE) policymakers over the inflation outlook. Investors reduce their bets on BoE rate cuts, which provide some support to the Cable. In the absence of top-tier economic data releases from the UK, the USD price dynamics will continue to play a key role in influencing the GBP/USD pair.
Forex News
Keep up with the financial markets, know what's happening and what is affecting the markets with our latest market updates. Analyze market movers, trends and build your trading strategies accordingly.