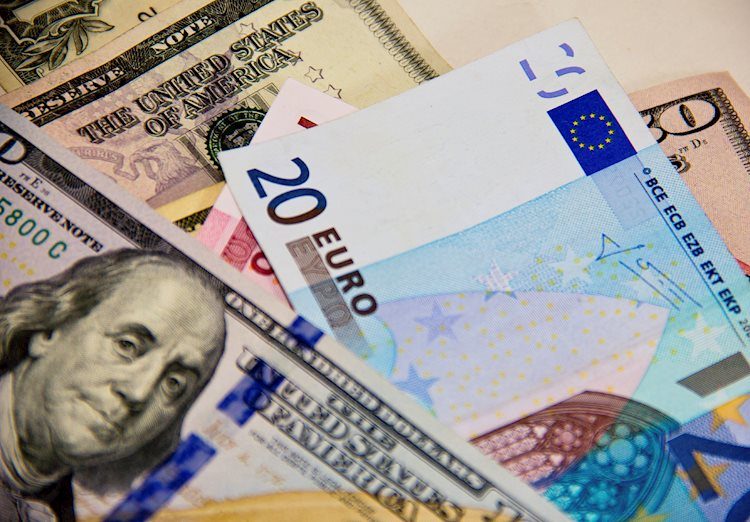
EUR/USD trades with negative bias, holds above 1.0700 as traders await US PCE Price Index
- EUR/USD meets with some supply amid the emergence of some USD buying on Friday.
- Bets that the Fed will keep rates higher for longer amid sticky inflation underpin the USD.
- Traders, however, seem reluctant and look to the US PCE Price Index for a fresh impetus.
The EUR/USD pair edges lower during the Asian session on Friday and moves away from a two-week high, around the 1.0740 area touched the previous day. Spot prices currently trade around the 1.0725-1.0720 region and remain at the mercy of the US Dollar (USD) price dynamics ahead of the crucial US data.
The US Personal Consumption Expenditures (PCE) Price Index data is due for release later during the North American session and will be looked upon for cues about the Federal Reserve's (Fed) rate cut path. This, in turn, will play a key role in influencing the near-term USD price dynamics. In the meantime, growing acceptance that the US central bank will keep interest rates higher for longer lends some support to the Greenback and exerts some downward pressure on the EUR/USD pair.
Investors have pushed back their expectations about the timing of the first rate cut by the Fed to September. The bets were reaffirmed by data released on Thursday, which showed that the underlying inflation rose more than expected in the first quarter. This helps offset a deceleration in the economic growth to a 1.6% annualized rate during the January-March quarter – marking the weakest reading since mid-2022 – and keeps the US Treasury bond yields elevated, underpinning the USD.
Apart from this, bets that the European Central Bank (ECB) will start cutting interest rates in June, amid a faster-than-anticipated fall in the Eurozone inflation, suggests that the path of least resistance for the EUR/USD pair is to the downside. That said, it will still be prudent to wait for strong follow-through selling before confirming that the recent recovery from the 1.0600 mark, or the YTD low has run its course traders await the key US inflation data.
Forex News
Keep up with the financial markets, know what's happening and what is affecting the markets with our latest market updates. Analyze market movers, trends and build your trading strategies accordingly.