Silver Price Analysis: Silver price forming a Bear Flag price pattern
- Silver price is still probably forming a Bear Flag pattern on the 4-hour chart.
- The pattern indicates a probable continuation of the bearish trend to targets substantially lower.
- Support from a long-term support and resistance level at $25.80 is likely to provide a floor for any sell-off.
Silver (XAG/USD) price may have formed a Bear Flag pattern on the 4-hour chart with negative implications for the precious metal’s price going forward.
4-hour Chart
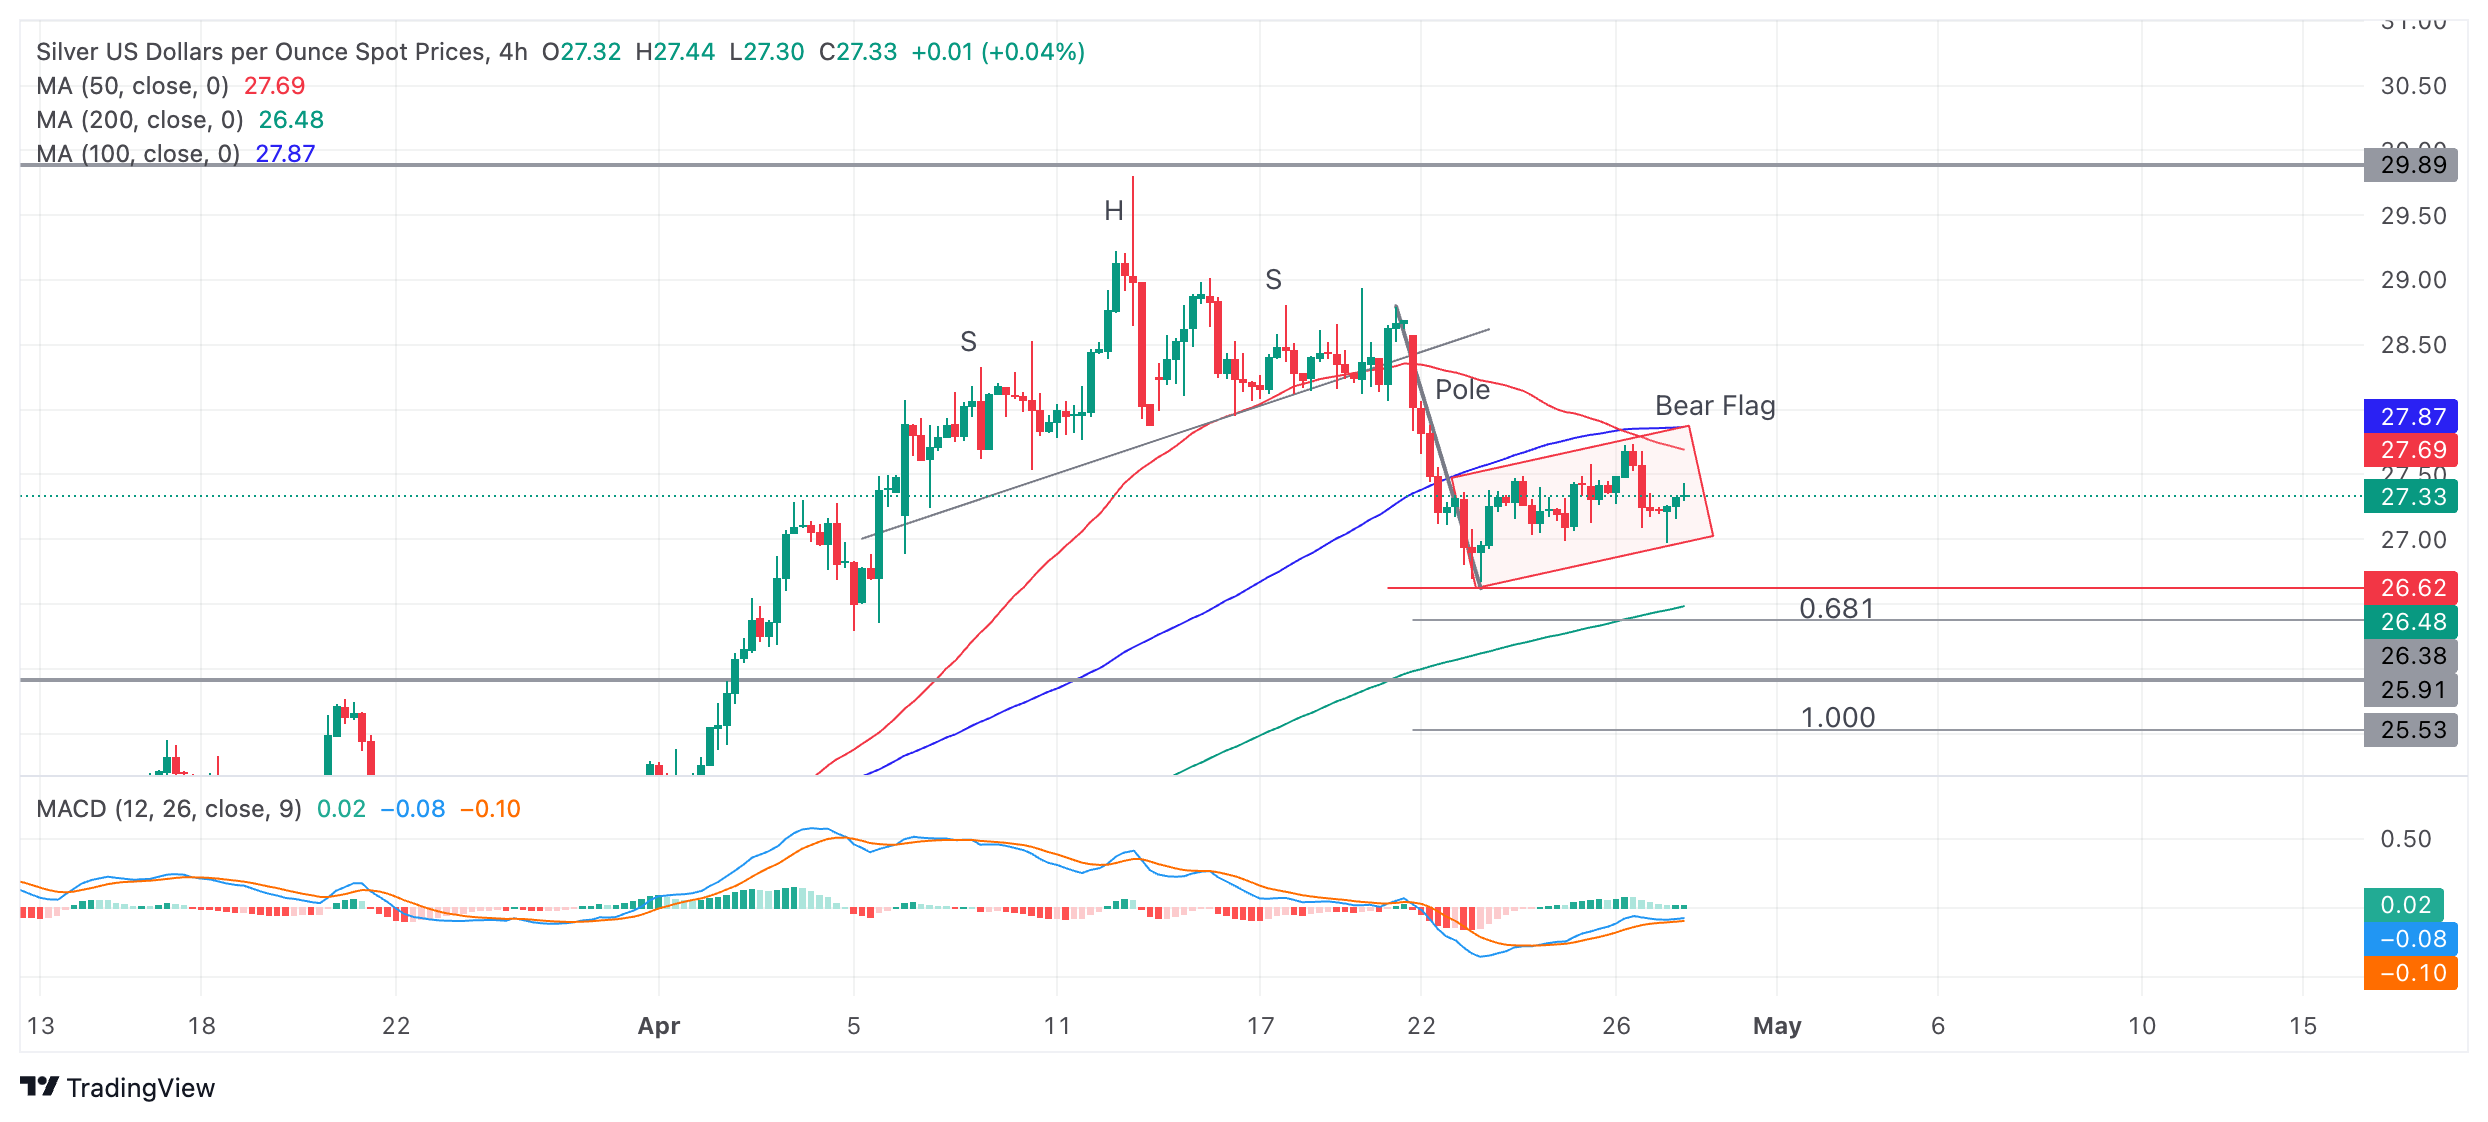
After a steep decline between April 19-23 Silver price bounced off support at $26.70 and has since consolidated into a rectangle pattern. Taken together with the prior sell-off the whole formation resembles a Bear Flag pattern.
According to technical lore, the expected move down from a Bear Flag equals the length of the preceding “pole” or a Fibonacci ratio of the pole extrapolated from the flag pattern down. In this case the pole is the decline between April 19-23.
The Fibonacci 0.618 ratio of the pole gives a conservative target at roughly $26.30. If Silver price falls the whole length of the pole (Fib. 1.000), however, it will reach a more optimistic target of around $25.50.
Tough support from a long-term upper range boundary line at about $25.80, however, is likely to offer support before Silver price reaches the lower target for the Bear Flag.
A break below the $26.69 low of April 23 would be required to confirm a breakdown of the Bear Flag towards its targets.
In February Silver price started rallying up to the top of a 4-year consolidation close to $30.00. After reaching just shy of this resistance level it formed a multiple shouldered Head and Shoulders (H&S) topping pattern in mid-April.
Silver price then declined to the initial target for the H&S pattern at $26.70 and bounced. Since then it has been consolidating.
Forex News
Keep up with the financial markets, know what's happening and what is affecting the markets with our latest market updates. Analyze market movers, trends and build your trading strategies accordingly.