
EUR/JPY Price Analysis: Extends its upside above 166.50 amid the overbought condition
- EUR/JPY gains traction near 166.85 on Thursday, the highest level since 2008.
- The cross keeps the bullish vibe, with the overbought RSI condition.
- The first resistance level will emerge at 166.82; the initial support level is located at 165.35.
The EUR/JPY cross trades in positive territory for the fifth consecutive day during the early European trading hours on Thursday. The cross edges higher to 166.85, its highest level since 2008. The Tokyo April Consumer Price Index (CPI) will be due on Friday ahead of the Bank of Japan (BoJ) interest rate decision. The markets expect the Japanese central bank to leave its policy rate and bond purchase amounts unchanged since BoJ raised interest rates in March for the first time since 2007. The divergence in rates between Japan and the Eurozone is the key factor that weighs the Japanese Yen (JPY) against the Euro (EUR).
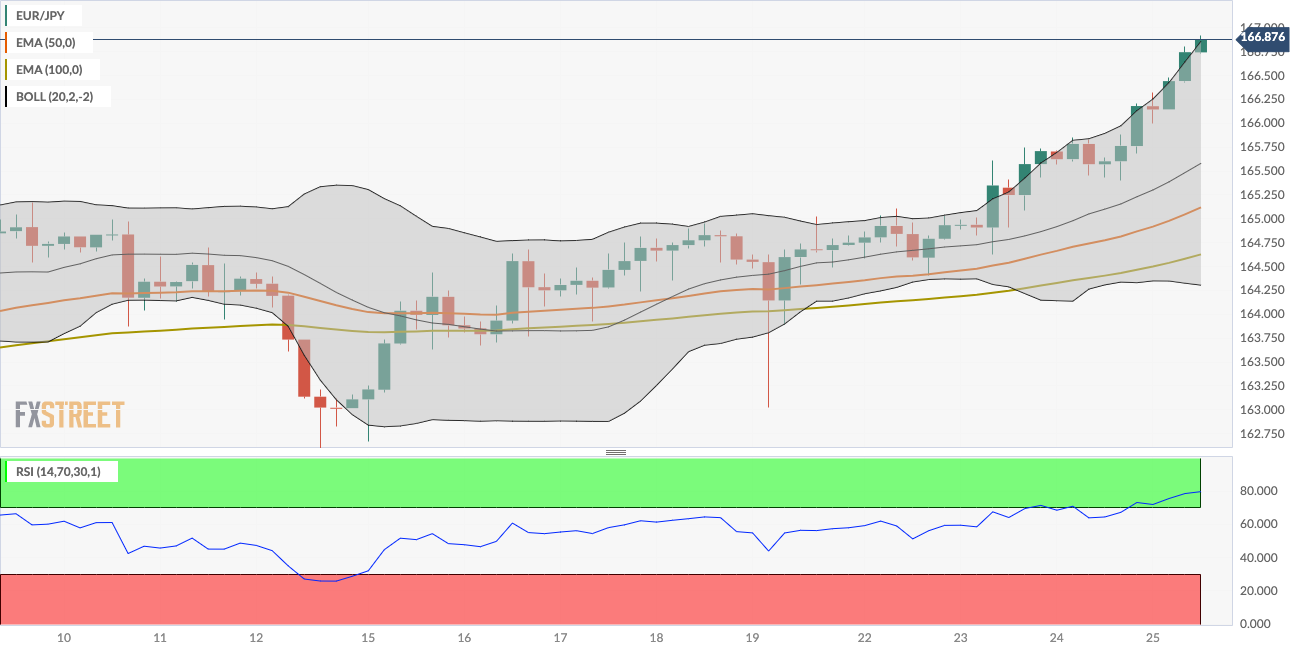
Technically, EUR/JPY maintains the bullish stance unchanged on the four-hour chart as the cross is above the 50-period and 100-period Exponential Moving Averages (EMA) with an upward slope. The Relative Strength Index (RSI) holds in bullish territory above 70. However, the overbought RSI condition indicates that further consolidation cannot be ruled out before positioning for any near-term EUR/JPY appreciation.
The first upside barrier for the cross will emerge near the upper boundary of the Bollinger Band at 166.82. The next hurdle is seen at the 167.00 psychological level. A bullish breakout above this level will see a rally to a yearly high of 2007 at 168.95, en route to an all-time high of 169.78 in July 2008.
On the flip side, the initial support level for the cross is located near a high of March 20 at 165.35. Further south, the next contention level to watch is the 50-period EMA at 165.11, followed by the 100-period EMA at 164.62. A breach of this level will see a drop to the lower limit of the Bollinger Band at 164.30.
EUR/JPY four-hour chart
Forex News
Keep up with the financial markets, know what's happening and what is affecting the markets with our latest market updates. Analyze market movers, trends and build your trading strategies accordingly.


