GBP/USD Price Analysis: Drops below 200-DMA, at cross-roads to resume downtrend
- GBP/USD declines 0.36% from its daily peak, under pressure from indications of rising US inflation.
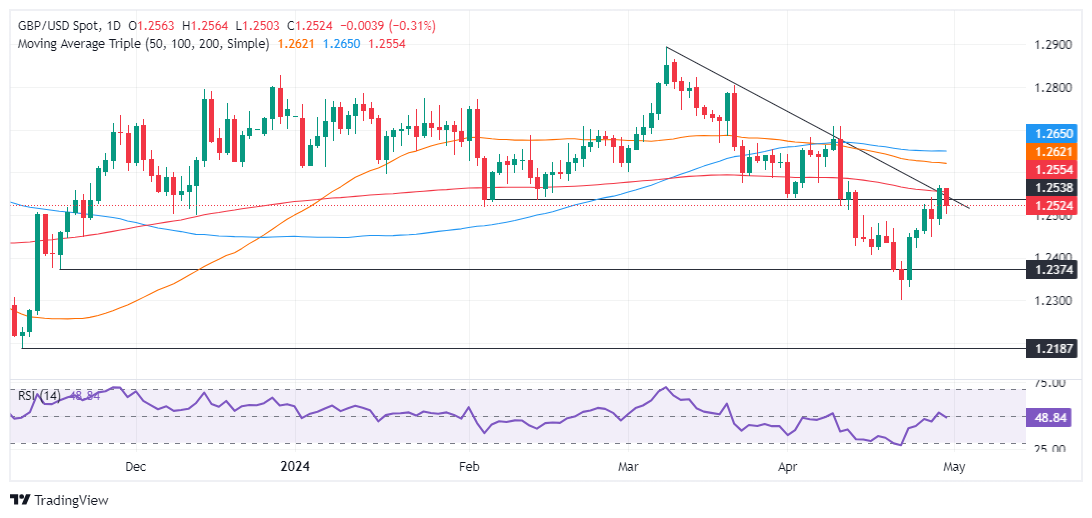
- The pair struggles above the 200-day moving average at 1.2564, hinting at potential further declines.
- Support levels are seen at: November 14, 2023, high of 1.2506; breaching this could lead to further support tests at 1.2448 and the year-to-date low of 1.2299.
- A recovery above the 200-DMA could reignite bullish momentum, aiming for 1.2600, with additional resistance at the 50-DMA and 100-DMA at 1.2619 and 1.2645.
The Pound Sterling reverses its course against the US Dollar, after extending its gains past the 200-day moving average (DMA). However, data from the United States (US), showing that inflation could be picking up, as shown by the Employment Cost Index (ECI), bolstered the Greenback. Therefore, the GBP/USD trades at 1.2517 down by some 0.36%, after hitting a daily high of 1.2563.
GBP/USD Price Analysis: Technical outlook
The GBP/USD is neutral biased, though failure to cling above the 200-DMA at 1.2564 might open the door for a pullback, with traders eyeing a test of the November 14, 2023, high at 1.2506. In the event of a drop below that level, further downside is seen at the April 26 intermediate support at 1.2448, before the major plunges to the year-to-date (YTD) low of 1.2299.
On the other hand, if the pair edges above the 200-DMA that would pave the way for testing 1.2600. Once surpassed, key resistance levels emerge. The 50-DMA is up next at 1.2619, followed by the 100-DMA at 1.2645. Subsequent gains are seen above those levels, exacerbating a rally toward 1.2700.
GBP/USD Price Action – Daily Chart
Forex News
Keep up with the financial markets, know what's happening and what is affecting the markets with our latest market updates. Analyze market movers, trends and build your trading strategies accordingly.