Gold Price Forecast: XAU/USD snaps two-day losing streak above $2,280 ahead of Fed rate decision
- Gold price trades on a positive note near $2,288 on Wednesday.
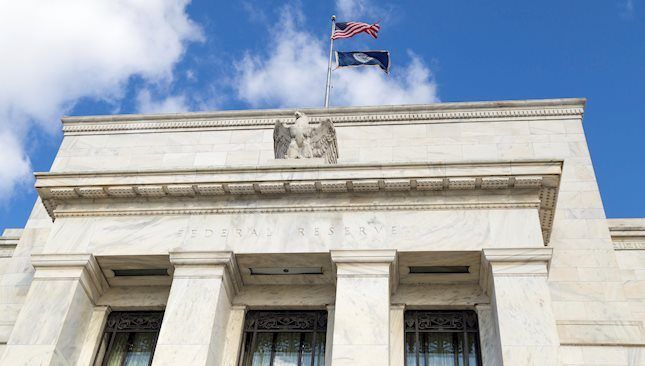
- The Federal Reserve is widely expected to keep rates steady; Fed’s Powell is anticipated to maintain a hawkish stance.
- The rising geopolitical risks could boost traditional safe-haven assets like gold.
Gold price (XAU/USD) posts modest gains around $2,288 on Wednesday during the Asian session. The precious metal edges higher as markets turn to a cautious mood ahead of the Federal Reserve's (Fed) monetary policy meeting on Wednesday. Elsewhere, the US ISM Manufacturing PMI and ADP Employment Change are due later in the day.
Meanwhile, the US Dollar Index (DXY), a measure of the value of the USD against a weighted basket of currencies used by US trade partners, recovers to a weekly high of 106.40. The US Treasury bond yields edge lower, with the 10-year yield falling to 4.67%.
The US Fed is expected to hold interest rates steady at its May meeting on Wednesday and maintain its hawkish stance. Fed easing expectations have been pushed out further, with the odds of a June cut falling to around 10% and the chance of September rate cuts dropping below 75%, according to the CME FedWatch tool. Investors will take more cues from the Press Conference after the Fed meeting. The hawkish tone of the Fed might lift the Greenback and diminish the appeal of non-yielding metals.
On the other hand, China, the world's top gold consumer, has bought gold steadily since October 2022, marking its longest buildup of the precious metal since at least 2000. This, in turn, helps boost the further upside of the precious metal.
Furthermore, China's massive and ongoing central bank gold purchases are increasing suspicions that the government may not only be strengthening its currency but also laying the economic groundwork for a full-scale invasion of Taiwan, a Telegraph report reported Tuesday. Gold traders will monitor the developments surrounding the China-Taiwan tension, along with the geopolitical tensions in the Middle East. Any escalating tension risks might boost safe-haven flows and benefit the gold price.
Forex News
Keep up with the financial markets, know what's happening and what is affecting the markets with our latest market updates. Analyze market movers, trends and build your trading strategies accordingly.