
NZD/USD Price Analysis: Bearish bias emerges as pair plunges
- NZD/USD falls 0.84% on Friday to trade at 0.6170.
- The RSI and MACD indicators align with the bearish outlook, signaling negative momentum.
- The 20-day SMA presents a strong barrier against the sellers.
The NZD/USD pair has been trading lacklusterly within a narrow range, but Friday's sharp decline has shifted the technical outlook to bearish, at least for the short-term, shedding more than 0.80% at the end of the week.
The Relative Strength Index (RSI) has turned sharply lower, indicating that the momentum is shifting in favor of the bears. The RSI is currently trading at 52, which is in neutral territory. However, the sharp decline suggests that the pair is likely to break below the 50 level, which would confirm the bearish trend. The Moving Average Convergence Divergence (MACD) printed a fresh red bar and also suggests that the momentum is negative and that the pair is likely to continue to decline.
NZD/USD daily chart
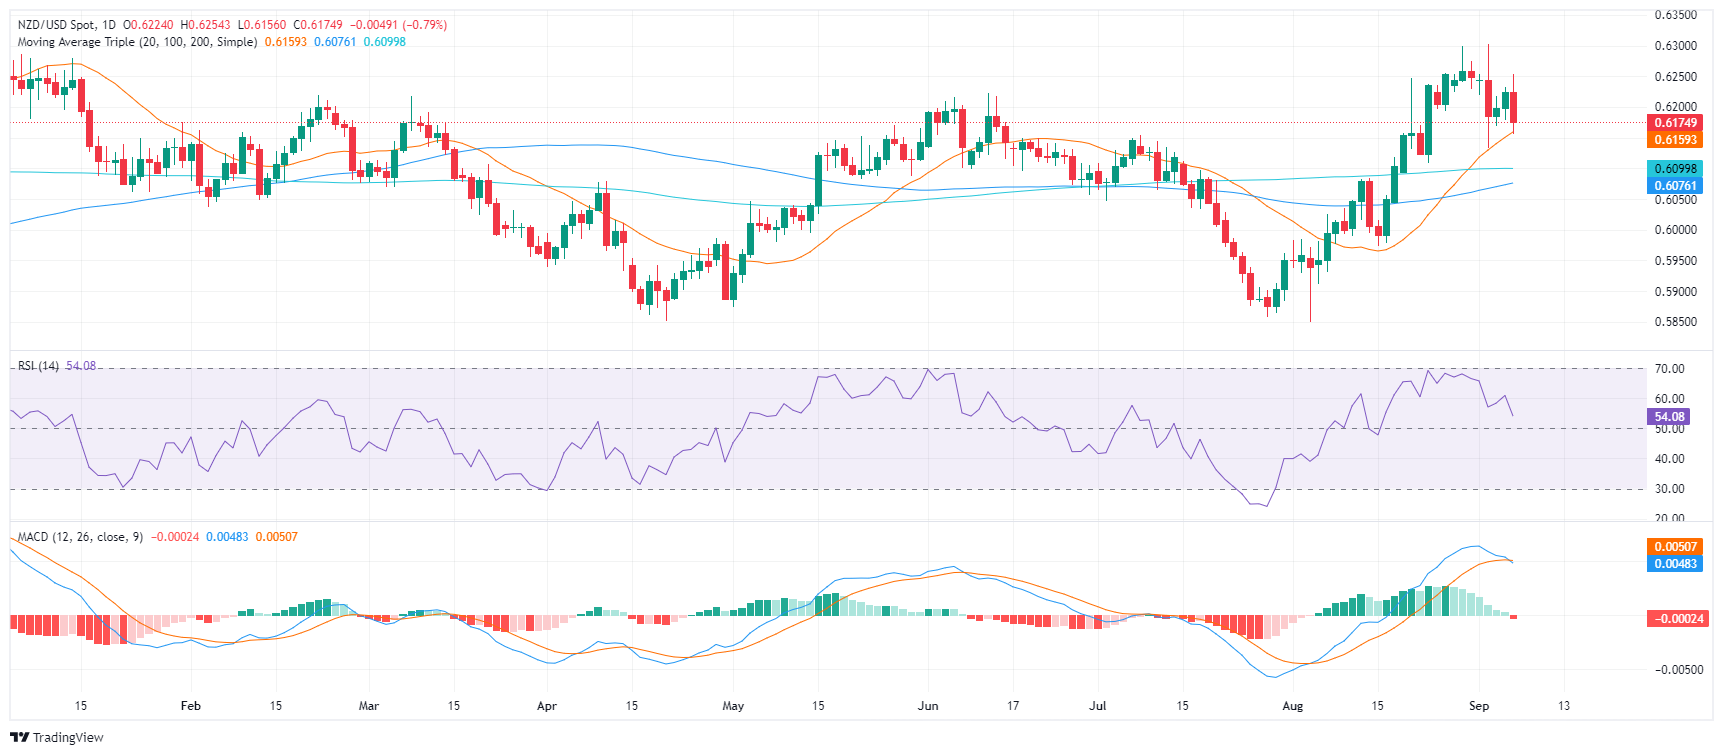
The 20-day SMA at 0.6160 provides strong support against the selling pressure but a break below this level would open the door for further declines toward 0.610-0.6150. However, if the pair manages to hold the line, the 0.6200 could be retested.
Forex News
Keep up with the financial markets, know what's happening and what is affecting the markets with our latest market updates. Analyze market movers, trends and build your trading strategies accordingly.