Gold Price Forecast: XAU/USD falls on upbeat US NFP data, yields spike
- Gold price dips despite week’s strong showing; US job growth exceeds expectations.
- Rising US Treasury bond yields and a robust USD exert downward pressure on gold.
- US debt-ceiling resolution eases bond yields, potential respite for gold.
Gold price slumps after hitting a daily high of $1977.87, as the release of a solid US jobs data report underpinned US Treasury bond yields, a headwind for the yellow metal. That, alongside a strong US Dollar (USD), keeps XAU/USD downward pressured but still set to end the week with decent gains. At the time of writing, the XAU/USD is trading below the $1950 area.
XAU/USD falters amidst robust US data, Treasury yields surge and heightened Fed rate hike expectations
A risk on impulse keeps safe-haven assets under pressure, as Wall Street shrugged off a solid employment report from the United States (US). On Friday, the US Department of Labor revealed May’s Nonfarm Payrolls report, which crushed estimates of 190K, as the economy created 339K jobs. Regardings to the Unemployment Rate grew by 3.7% YoY from 3.4%.
US Treasury bond yields reacted to the upside, with 2s jumping 16 bps to 4.501%, while 10s stand at 3.689%, gaining nine bps. The greenback edged up 0.43% as shown by the US Dollar Index at 104.026, ready to post its first weekly loss, snapping three weeks of gains.
Bets that the US Federal Reserve will keep rates unchanged at the June meeting increased, although, in July, it is almost sure that the US central bank will raise rates by 25 bps.
Should be said that once the US House and Senate approved the US debt-ceiling bill, US bond yields dropped. The bill would be signed by US President Joe Biden during the weekend, ending the soap opera.
XAU/USD Price Analysis: Technical outlook
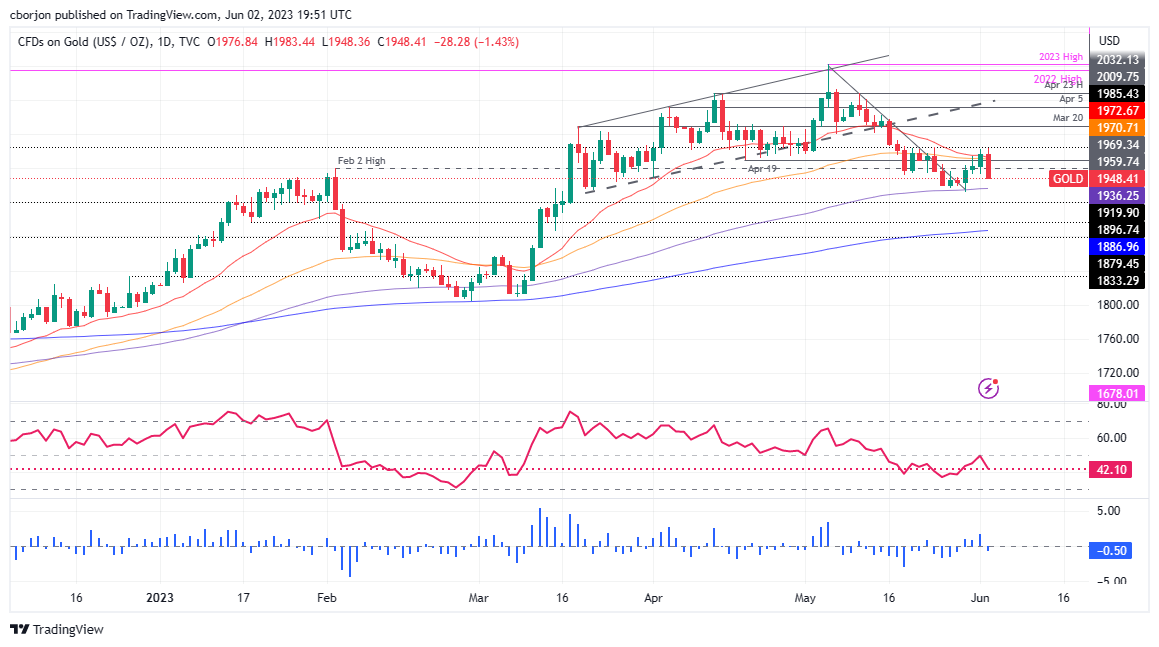
XAU/USD is neutral to downward biased, even though the Gold spot remains trading above the 200-day Exponential Moving Average (EMA) at $1886.98. As the yellow metal registered successive series of lower highs, despite pending confirmation for a second lower-low, it turned the bias slightly downwards.
Oscillators like the Relative Strength Index (RSI) and the 3-day Rate of Change (RoC) suggests sellers are in charge though a decisive break below $1950 would put them in the driver’s seat to challenge the 200-day EMA.
XAU/USD first support would be $1950, followed by the 100-day EMA at $1936.30. Once cleared, $1900 is up next. On the other hand, the XAU/USD first resistance would be the 50-day EMA at $1970.78, closely followed by the 20-day EMA at $1972.86. Upside risks lie at $2000.
Forex News
Keep up with the financial markets, know what's happening and what is affecting the markets with our latest market updates. Analyze market movers, trends and build your trading strategies accordingly.