
EUR/JPY Price Analysis: Bulls continue dominating, yet a consolidation may be incoming
- The daily RSI reveals increasing buying momentum, yet nearing overbought conditions hint at a potential technical correction ahead.
- The hourly chart indicates a shift in short-term momentum towards sellers, and indicators consolidate.
The EUR/JPY stands at 165.68, trading with mild gains still in multi-year highs. Current market trends lean towards bullish momentum, keeping buyers in a favorable position. However, daily indicators are nearing overbought conditions, while the hourly ones have already reached that threshold and seem to be consolidating ahead of the Asian session.
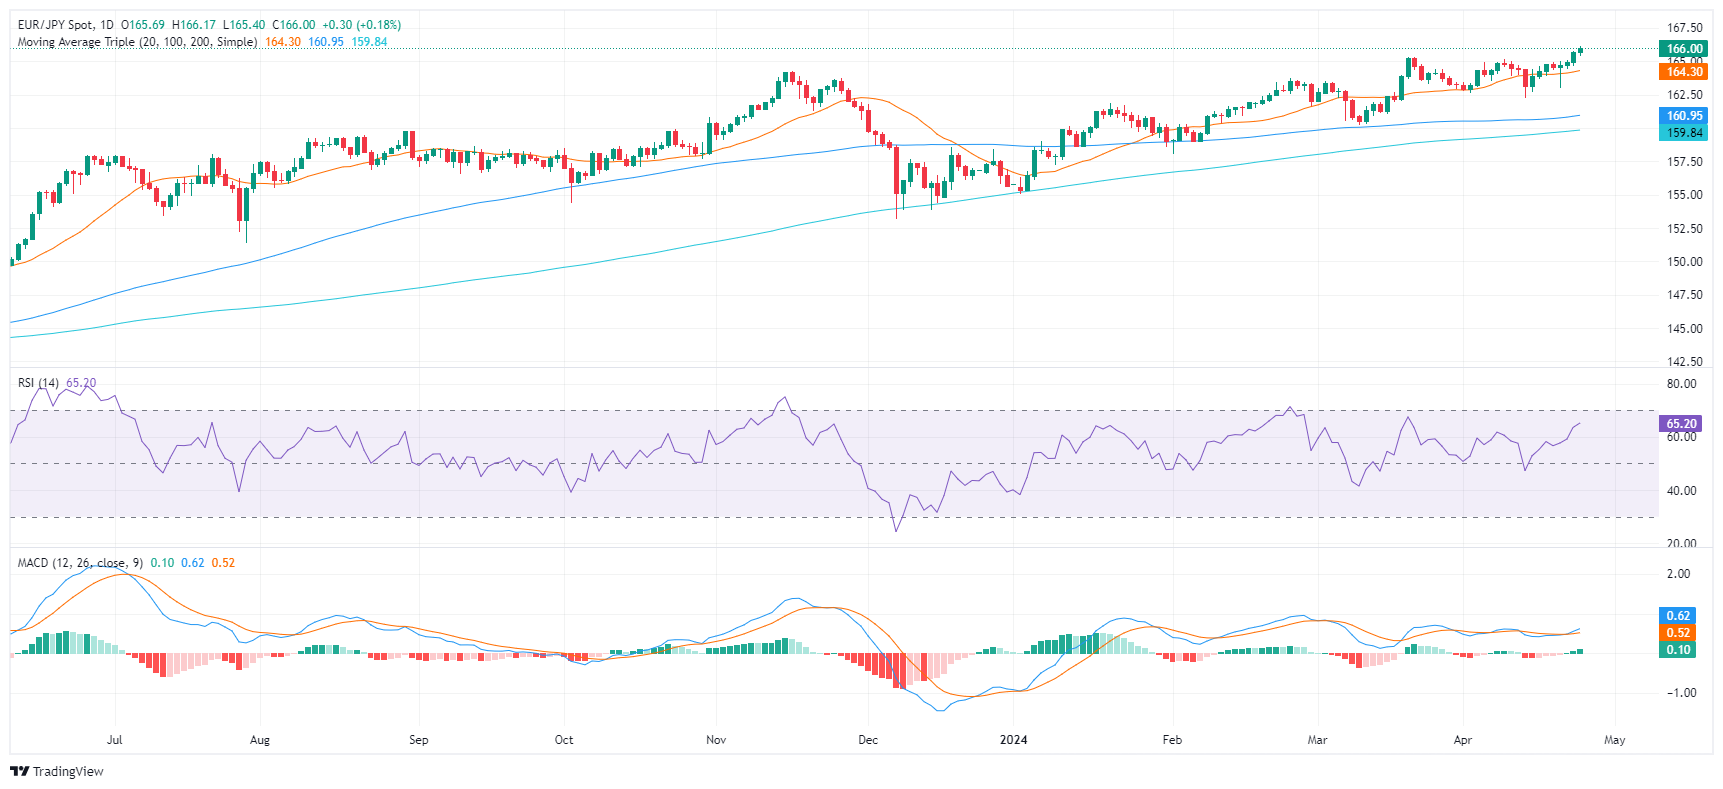
The Relative Strength Index (RSI) on the daily chart reveals a positive trend. It has climbed since mid-April from the mid-40s deep into positive territory with the latest reading at 65. This increase in RSI reveals that buyers have recently dominated the market. However, an approach towards the overbought threshold suggests a potential future market correction looming.
EUR/JPY Daily Chart
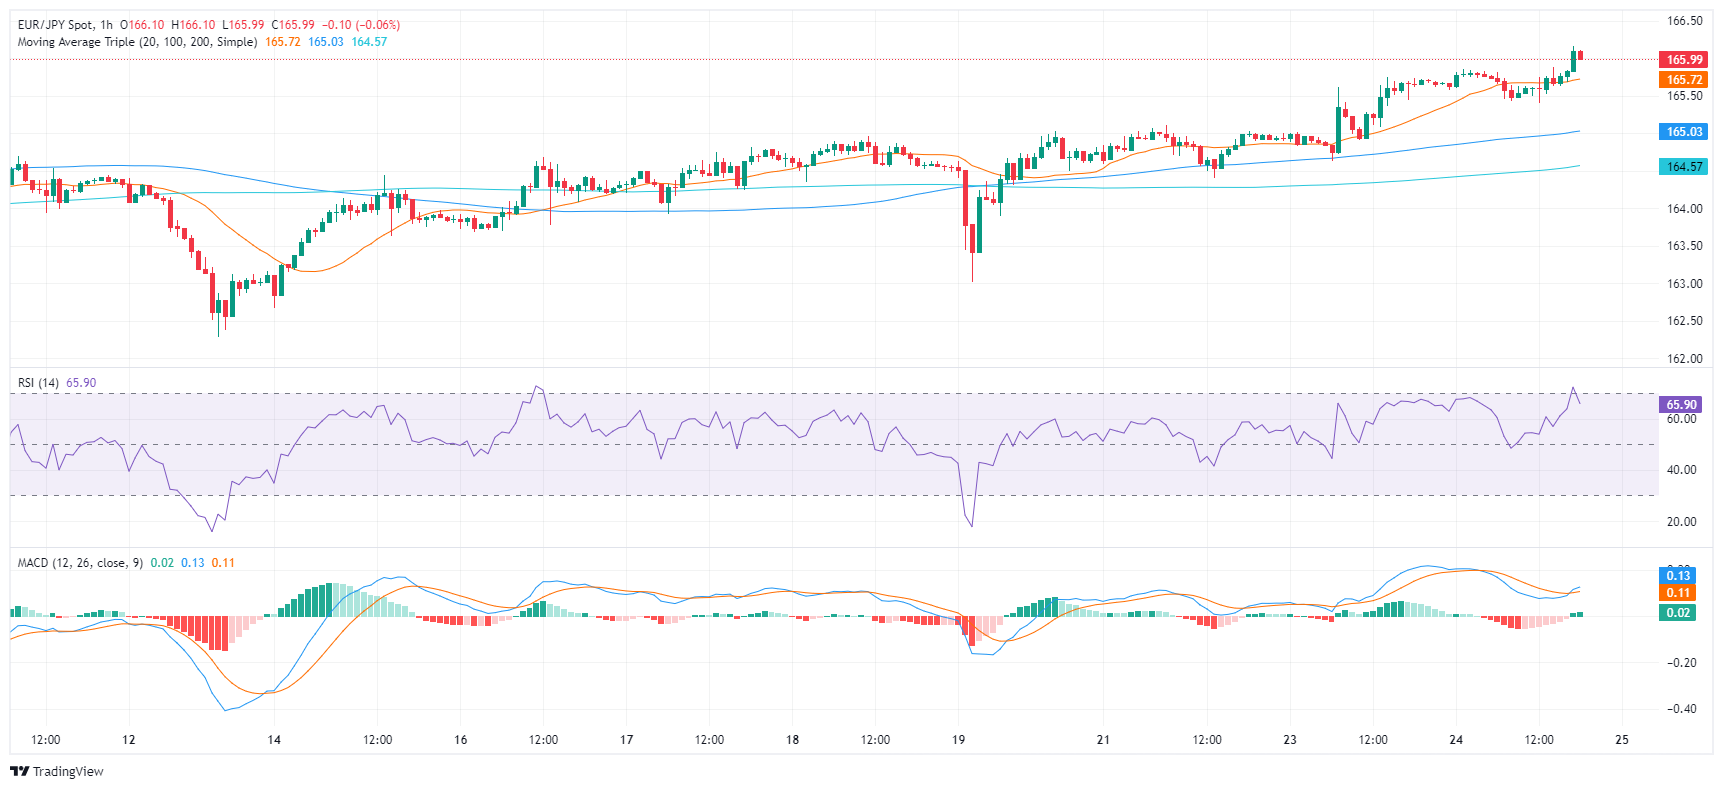
On the other hand, the hourly chart shows a slight fluctuation in RSI values, which have swung between 48 and 71 during the session and buyers now seem to be taking a breather. The Moving Average Convergence Divergence (MACD) prints flat green bars, adding arguments to a stagnant momentum.
EUR/JPY Hourly Chart
Regarding the overall trend, the EUR/JPY displays a bullish trajectory in the short term while maintaining its position above its 20-day Simple Moving Average (SMA). Turning to a longer time frame, the pair remains above 100- and 200-day SMAs. Such positioning could hint at the potential continuation of bullishness for the EUR/JPY pair.
Forex News
Keep up with the financial markets, know what's happening and what is affecting the markets with our latest market updates. Analyze market movers, trends and build your trading strategies accordingly.


