
NZD/USD Price Analysis: Bearish stance persists and bulls are running out of time
- The NZD/USD maintains a bearish stance while showing a flattening buying momentum on both daily and hourly charts.
- The bulls got rejected again by the 20-day SMA.
- Any upward movement that fails to conquer the mentioned SMA shouldn’t be considered a buying signal.
The NZD/USD pair rallied to 0.5980 on Monday and then stabilized around 0.5960, yet maintains a bearish outlook. While recent movements have shown increased buying momentum, significant positioning beneath key Simple Moving Averages (SMAs) indicates a larger bearish bias and as long as the pair is kept below this levels, the outlook will remain in favor of the bears.
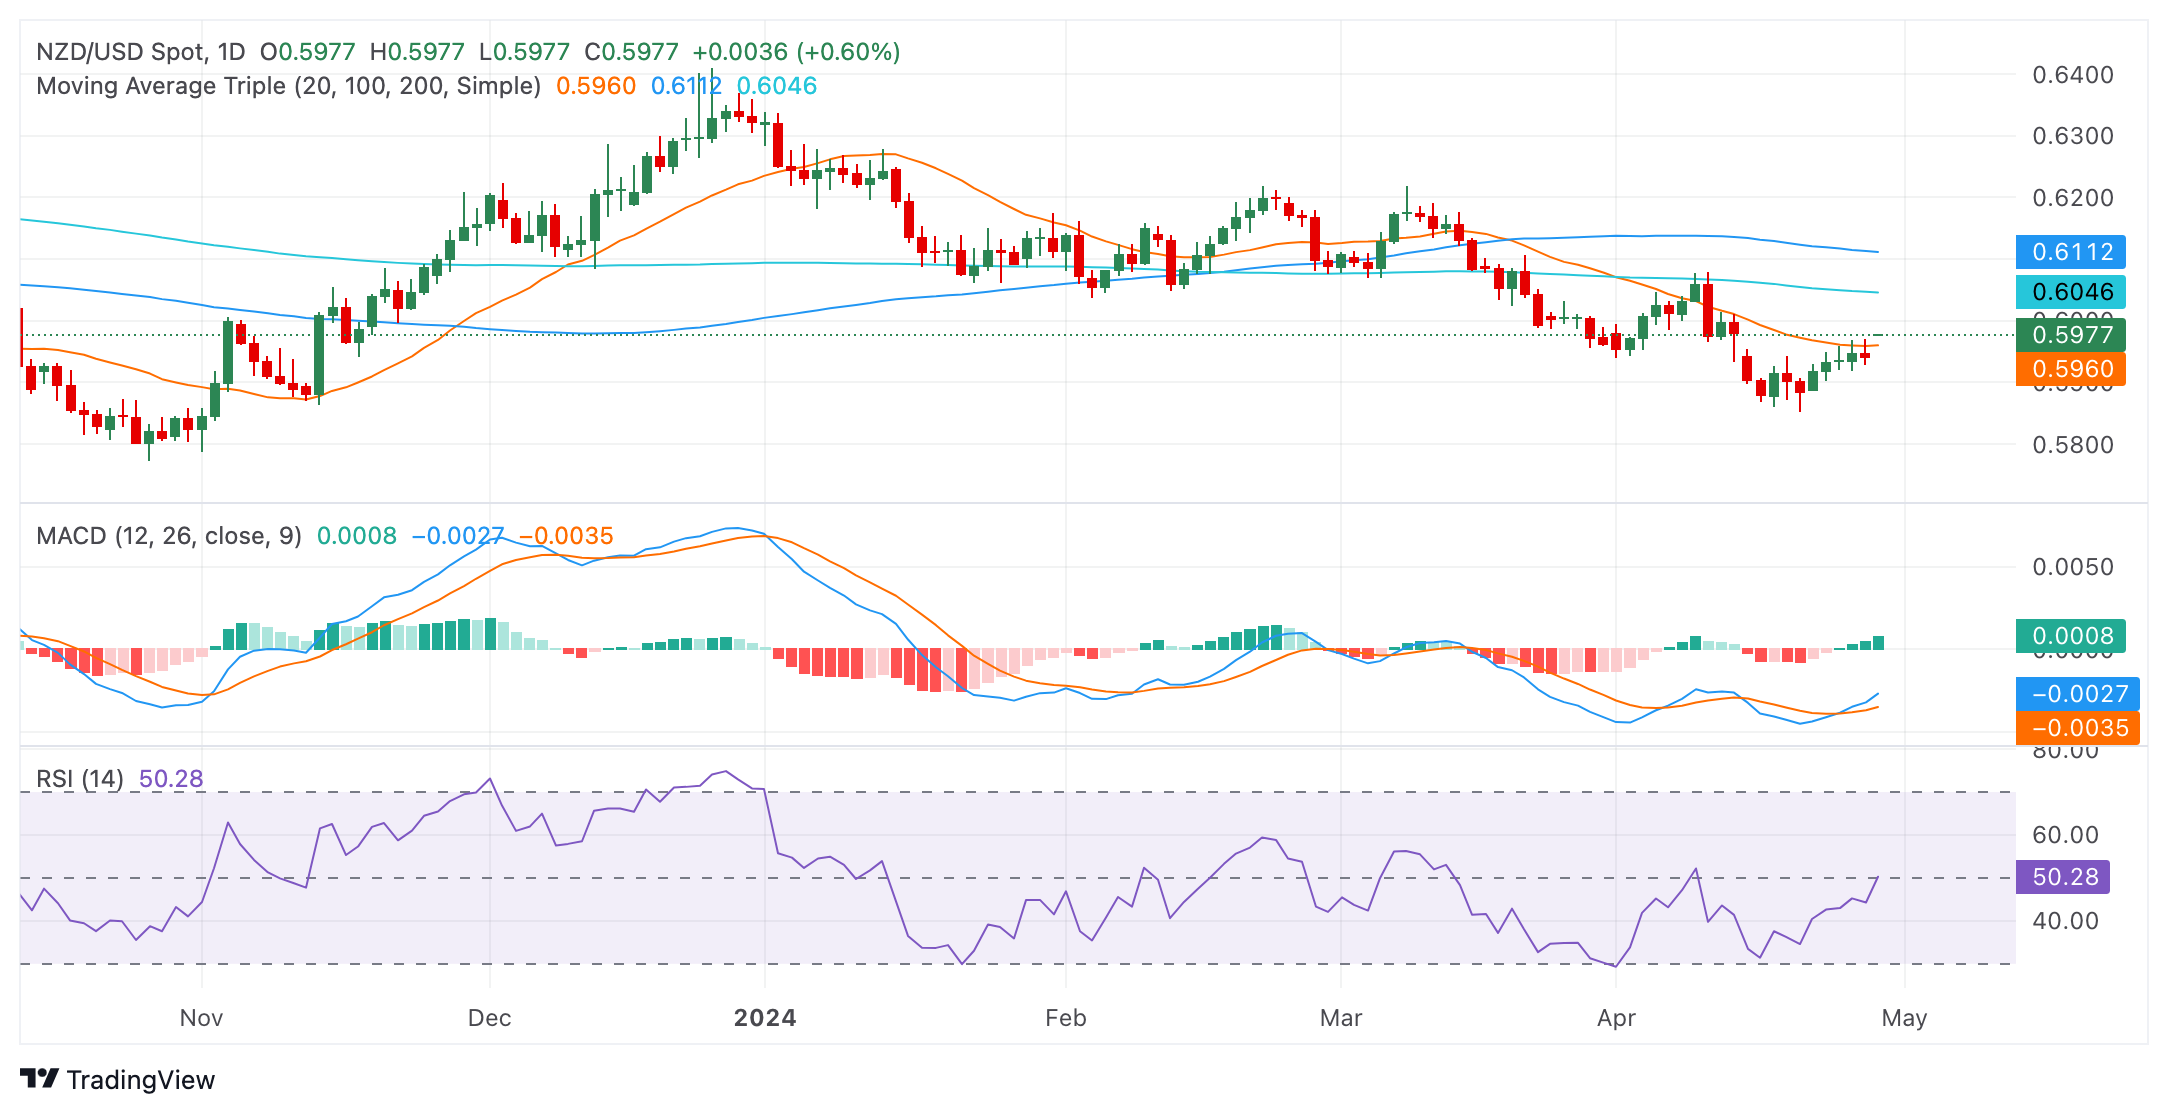
On the daily chart, the Relative Strength Index (RSI) indicates a positive trend for the NZD/USD pair. From the oversold territory, the index is now on its way to its middle point, demonstrating an increase in buying momentum. The Moving Average Convergence Divergence (MACD) histogram displays flat green bars, suggesting steady positive momentum with buyers dominating the market but warns of a flattening buying traction.
NZD/USD daily chart
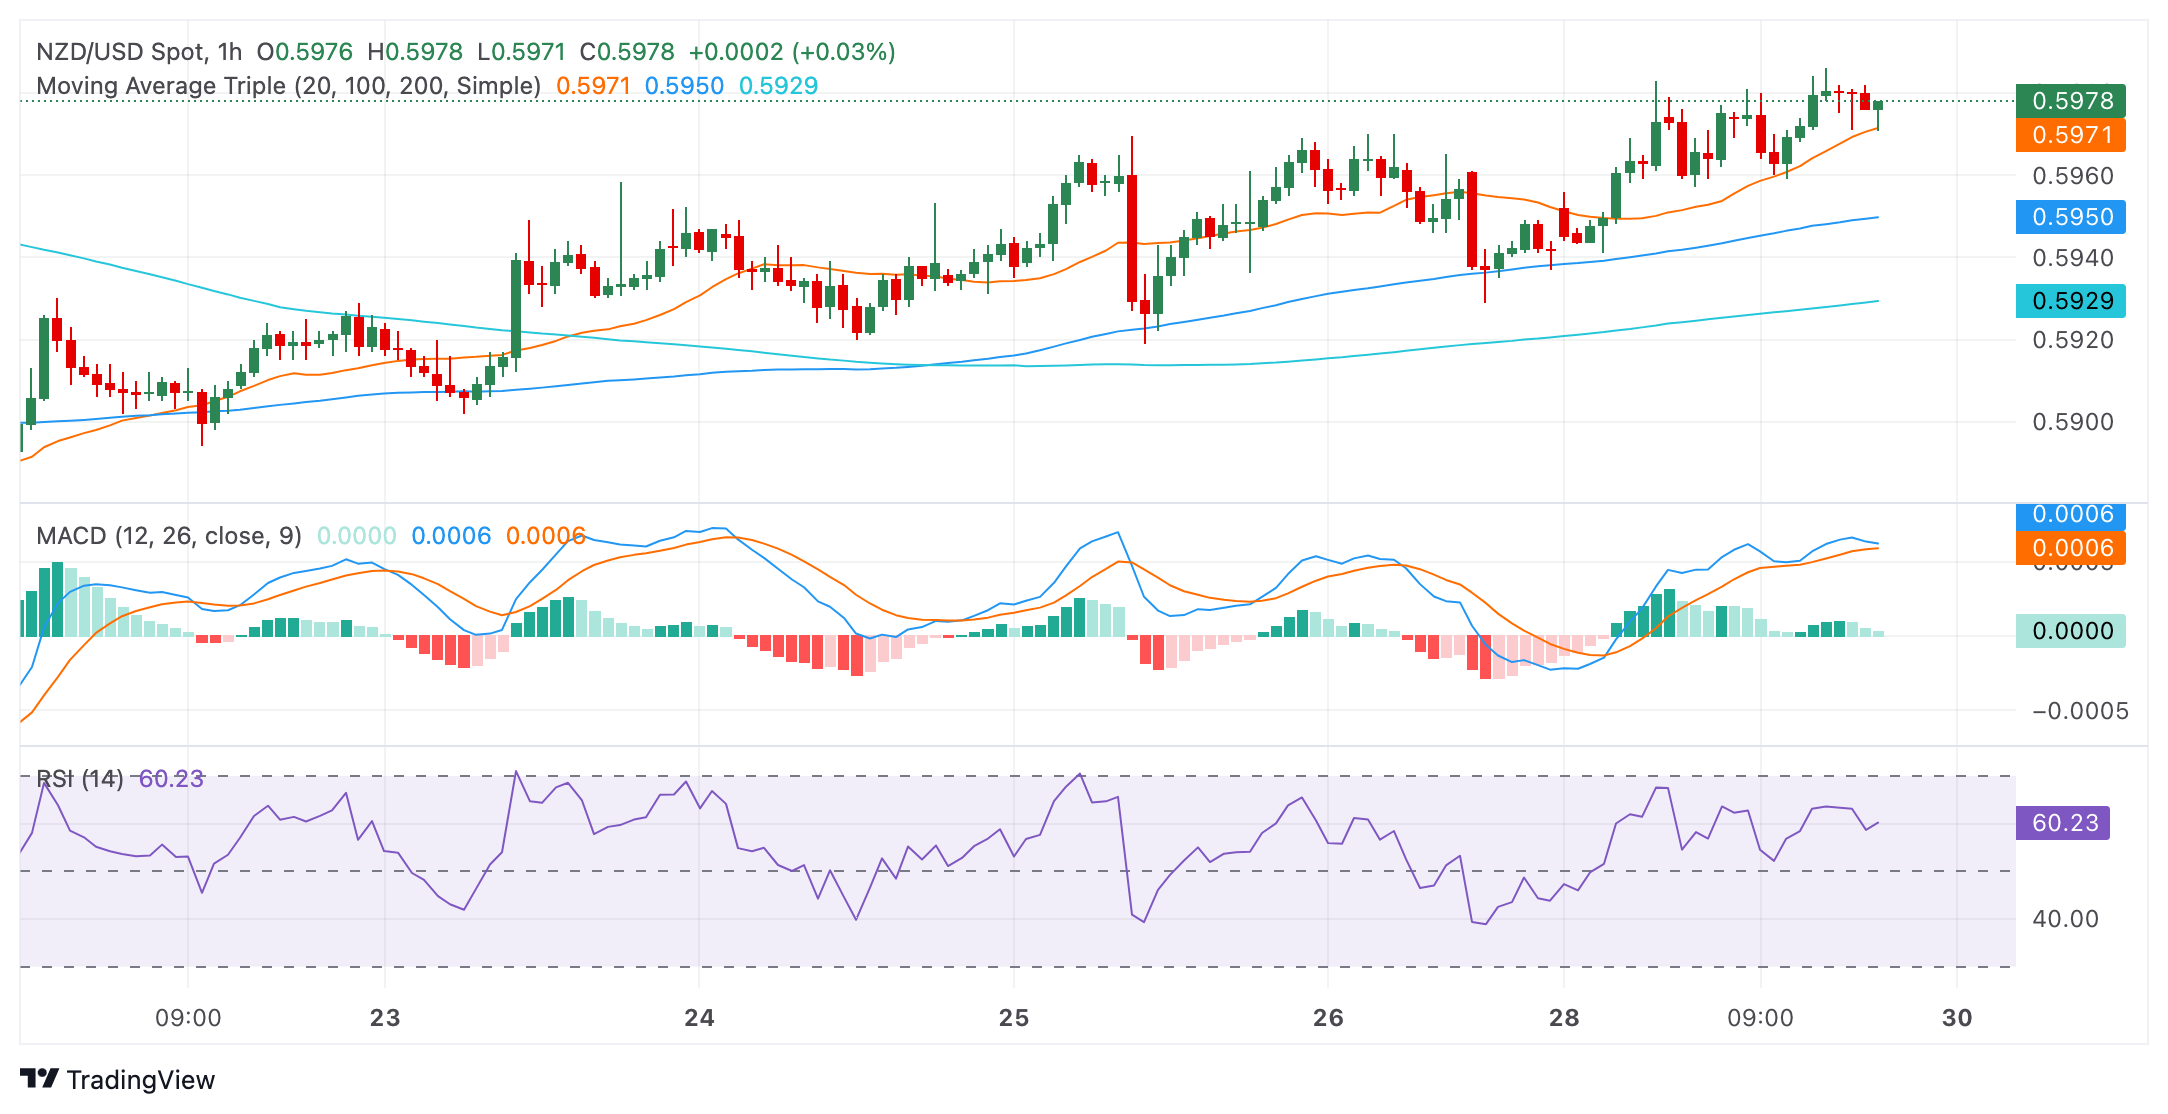
Transitioning to the hourly chart, the RSI maintains a positive outlook, hovering around the 57 mark but is currently pointing down, suggesting that the buyers are running out of steam in this timeframe. The MACD shows flat green bars, pointing to a more cautious uptrend.
NZD/USD hourly chart
While analyzing the broader scope, the pair currently sits in a bearish posture. The Kiwi's position below its 20, 100, and 200-day Simple Moving Average (SMA), indicates an overall downtrend. The 20-day SMA rejected the buyers at the 0.596 mark on Monday, which could discourage bullish traders. However, ahead of the Asian session, buyers might make an additional stride to recover that level which could brighten the outlook for the pair.
Forex News
Keep up with the financial markets, know what's happening and what is affecting the markets with our latest market updates. Analyze market movers, trends and build your trading strategies accordingly.