
AUD/JPY Price Analysis: Bullish momentum persists, downward correction likely
- The daily RSI for AUD/JPY reveals that the bulls are in charge, approaching overbought conditions.
- Despite the hourly MACD indicating a short-term dip, the RSI highlights the buyers' dominance.
- As the cross jumped to multi-year highs, the buyers might eventually run out of gas.
The AUD/JPY exhibits substantial bullish momentum, standing at the 101.39 level and showing an encouraging 0.54% rally. The dominance of bullish trends is evident but a healthy correction might be necessary for the buyers to conquer additional ground.
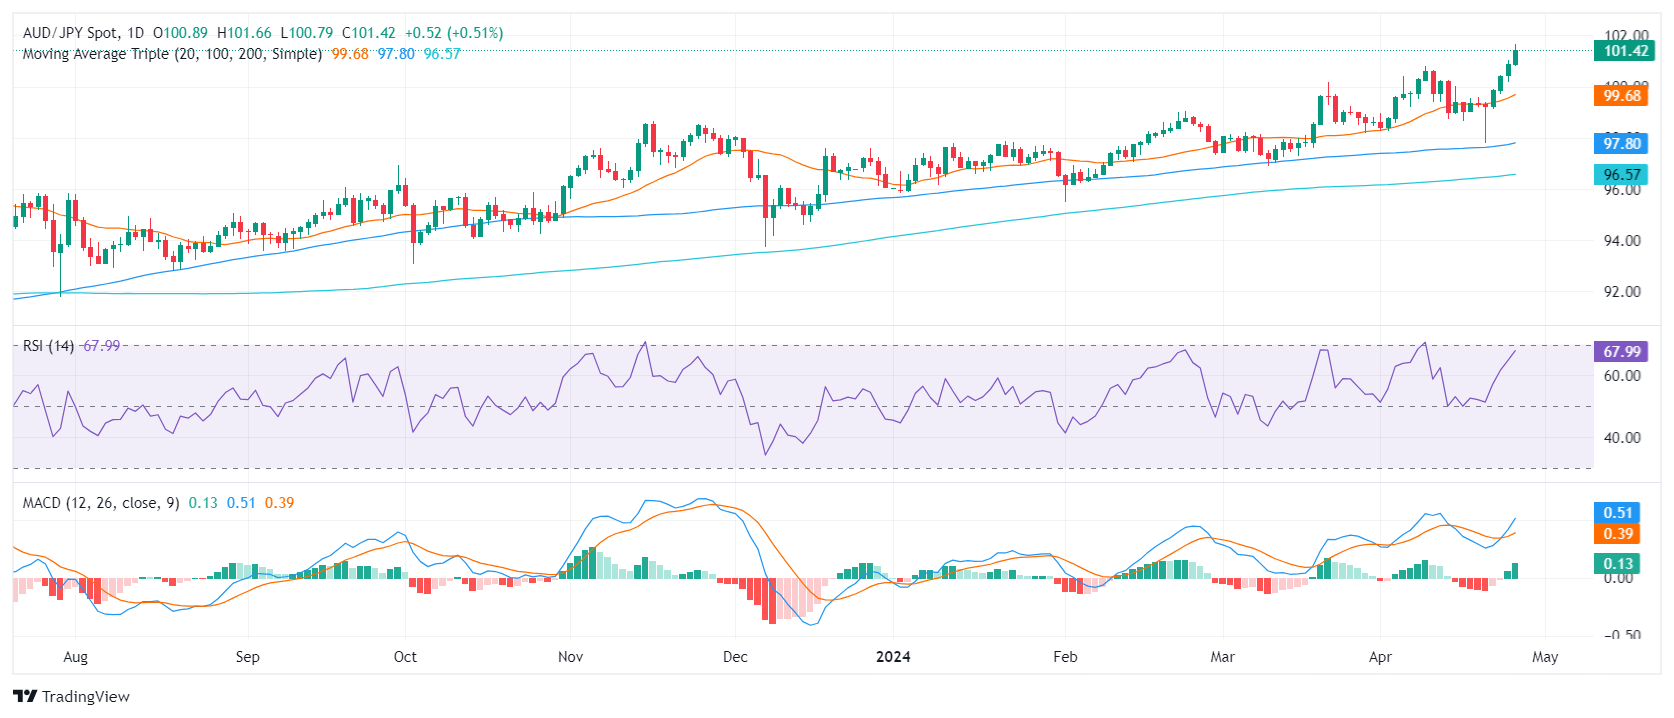
On the daily chart, the Relative Strength Index (RSI) reveals a positive momentum, with the latest reading nearing the overbought condition. The Moving Average Convergence Divergence (MACD) supports this, printing green bars.
AUD/JPY daily chart
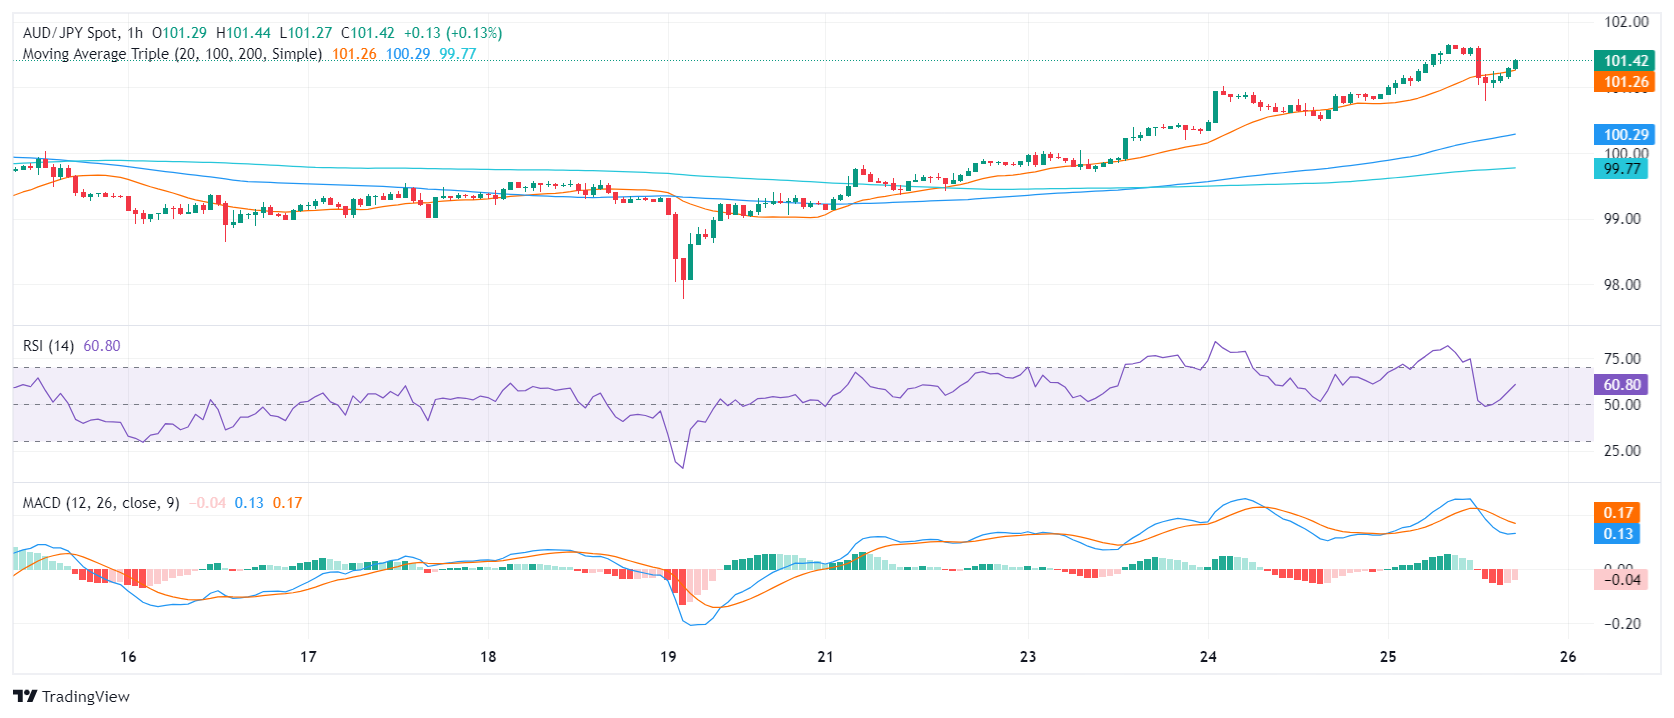
Shifting the attention to the hourly chart, the MACD paints a different picture with its red bars, signaling that in this timeframe, buyers might have already become exhausted. However, the RSI readings suggest steady, positive momentum with figures hovering above 50, apart from a brief dip to 48.
AUD/JPY hourly chart
The AUD/JPY also demonstrates a bullish stance in the broader picture as it positions itself above the 20, 100, and 200-day Simple Moving Averages (SMA). So all signals points to a clear bullish stance, but traders should be alert that if daily indicators reach overbought conditions, the pair may see some healthy downside to consolidate gains.
Forex News
Keep up with the financial markets, know what's happening and what is affecting the markets with our latest market updates. Analyze market movers, trends and build your trading strategies accordingly.


