-
Opps!
This language contents are not available!

EUR/USD Price Analysis: Holds below 1.0750 ahead of US Retail Sales data
- EUR/USD weakens around 1.0730 in Tuesday’s early European session.
- The negative outlook of the pair remains intact below the key 100-period EMA, with a bearish RSI indicator.
- The initial support level is seen at 1.0685; the key resistance level is located in the 1.0790–1.0800 zone.
The EUR/USD pair trades on a softer note near 1.0730 on Tuesday during the early European trading hours. The modest recovery of the Greenback drags the major pair lower. Traders prefer to wait on the sidelines ahead of the Eurozone Harmonized Index of Consumer Prices (HICP) inflation data and the US Retail Sales data. Retail Sales in the US are expected to rise 0.2% MoM in May.
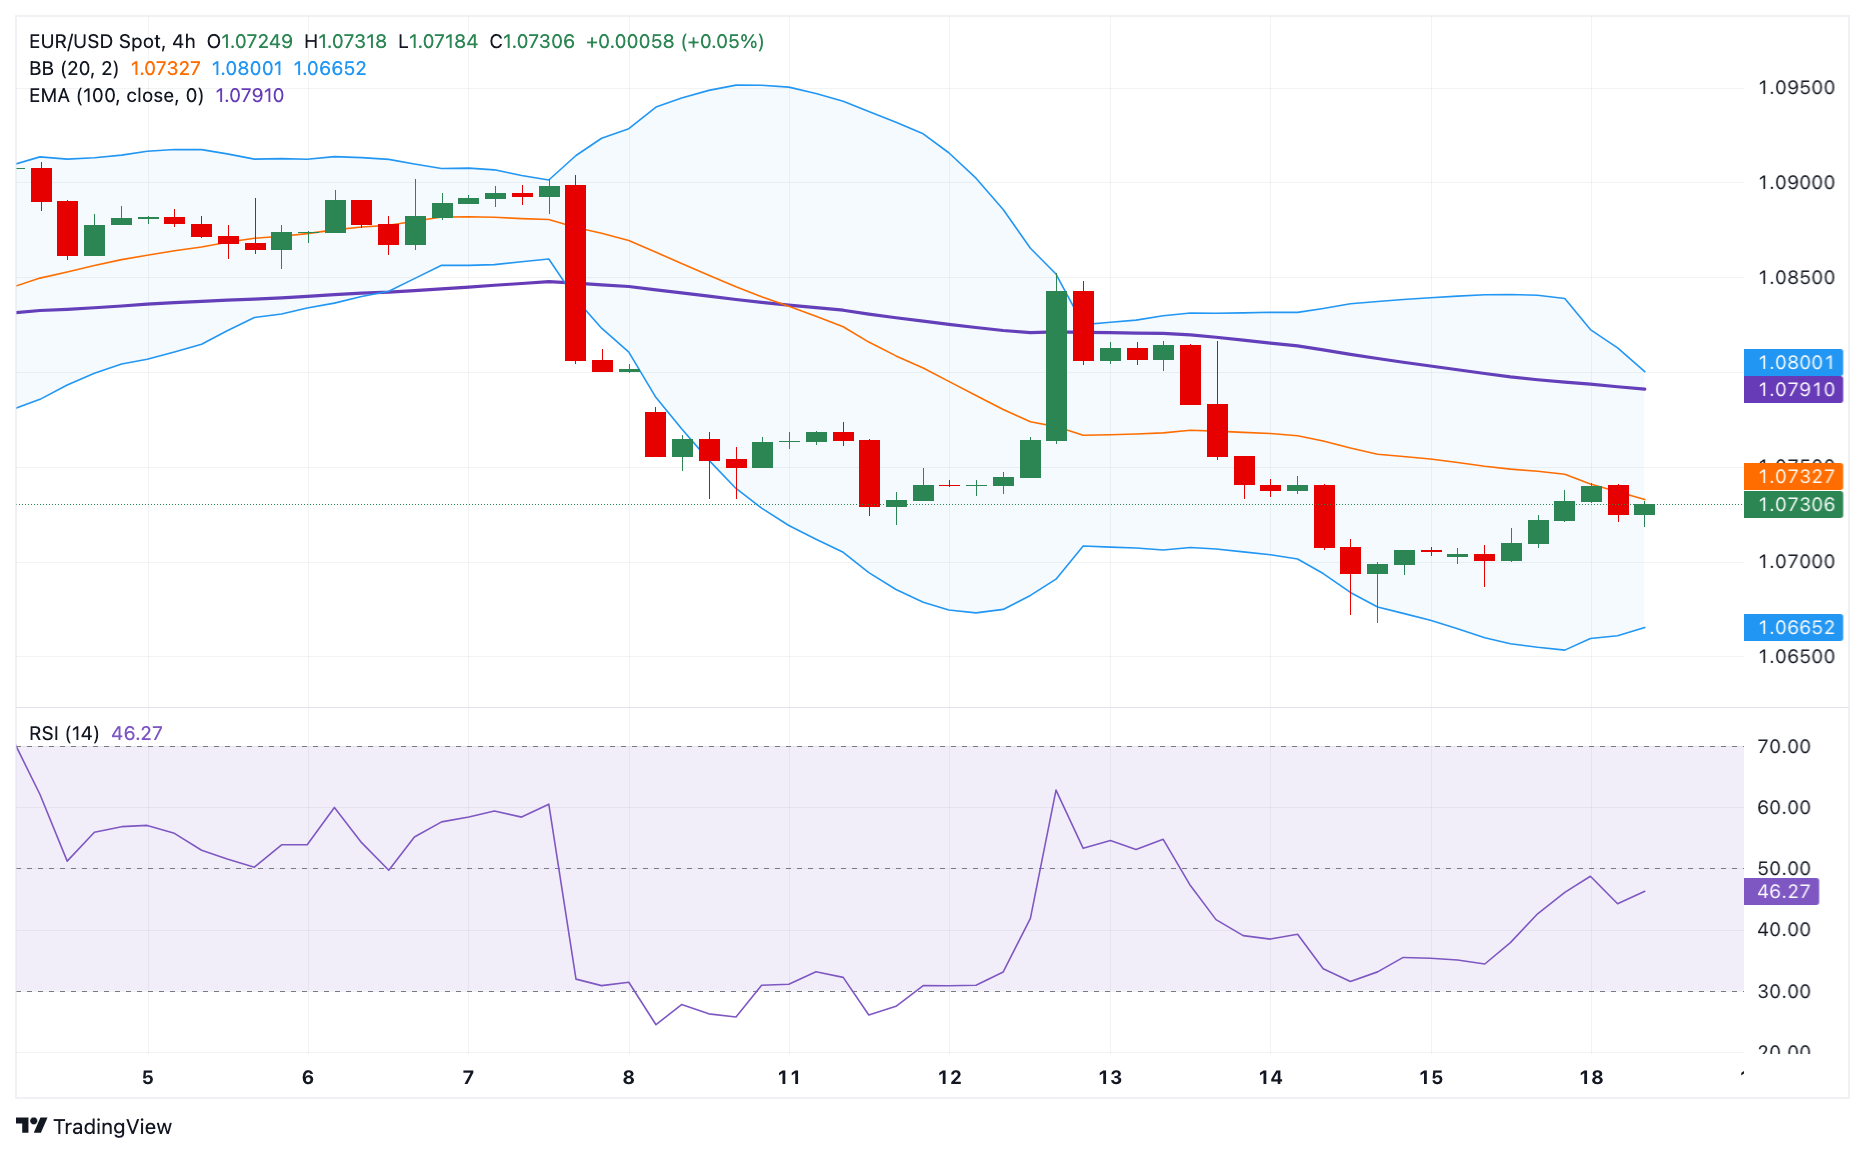
According to the 4-hour chart, EUR/USD keeps the bearish vibe unchanged as the major pair holds below the key 100-period Exponential Moving Average (EMA). The downward momentum is supported by the Relative Strength Index (RSI), which stands in the bearish zone near 43.0,. This suggests that the path of least resistance is to the downside.
The initial support level for the major pair is seen at 1.0685, a low of June 17. Further south, the downside target to watch is 1.0665, the lower limit of Bollinger Band. A break below the latter will see a drop to 1.0610, a low of April 19.
On the upside, any follow-through buying above an intraday high of 1.0741 will see a rally to the crucial upside barrier at the 1.0790–1.0800 region. The mentioned level is the confluence of the upper boundary of the Bollinger Band and the psychological level. A break above this level will pave the way to 1.0852, a high of June 12.
EUR/USD 4-hour chart
EUR/USD
| Overview | |
|---|---|
| Today last price | 1.0725 |
| Today Daily Change | -0.0009 |
| Today Daily Change % | -0.08 |
| Today daily open | 1.0734 |
| Trends | |
|---|---|
| Daily SMA20 | 1.0819 |
| Daily SMA50 | 1.0771 |
| Daily SMA100 | 1.08 |
| Daily SMA200 | 1.0789 |
| Levels | |
|---|---|
| Previous Daily High | 1.0738 |
| Previous Daily Low | 1.0686 |
| Previous Weekly High | 1.0852 |
| Previous Weekly Low | 1.0668 |
| Previous Monthly High | 1.0895 |
| Previous Monthly Low | 1.065 |
| Daily Fibonacci 38.2% | 1.0718 |
| Daily Fibonacci 61.8% | 1.0706 |
| Daily Pivot Point S1 | 1.0701 |
| Daily Pivot Point S2 | 1.0668 |
| Daily Pivot Point S3 | 1.065 |
| Daily Pivot Point R1 | 1.0753 |
| Daily Pivot Point R2 | 1.0771 |
| Daily Pivot Point R3 | 1.0804 |
Forex News
Keep up with the financial markets, know what's happening and what is affecting the markets with our latest market updates. Analyze market movers, trends and build your trading strategies accordingly.
