-
Opps!
This language contents are not available!
USD/CAD Price Analysis: Battles at the 20-day EMA, drops toward 1.3530s
- USD/CAD struggles at the 20-day EMA and tumbles towards the 1.3530 area.
- USD/CAD Price Analysis: Oscillators offering mixed signals, but price action stalling at crucial EMAs to keep the pair rangebound.
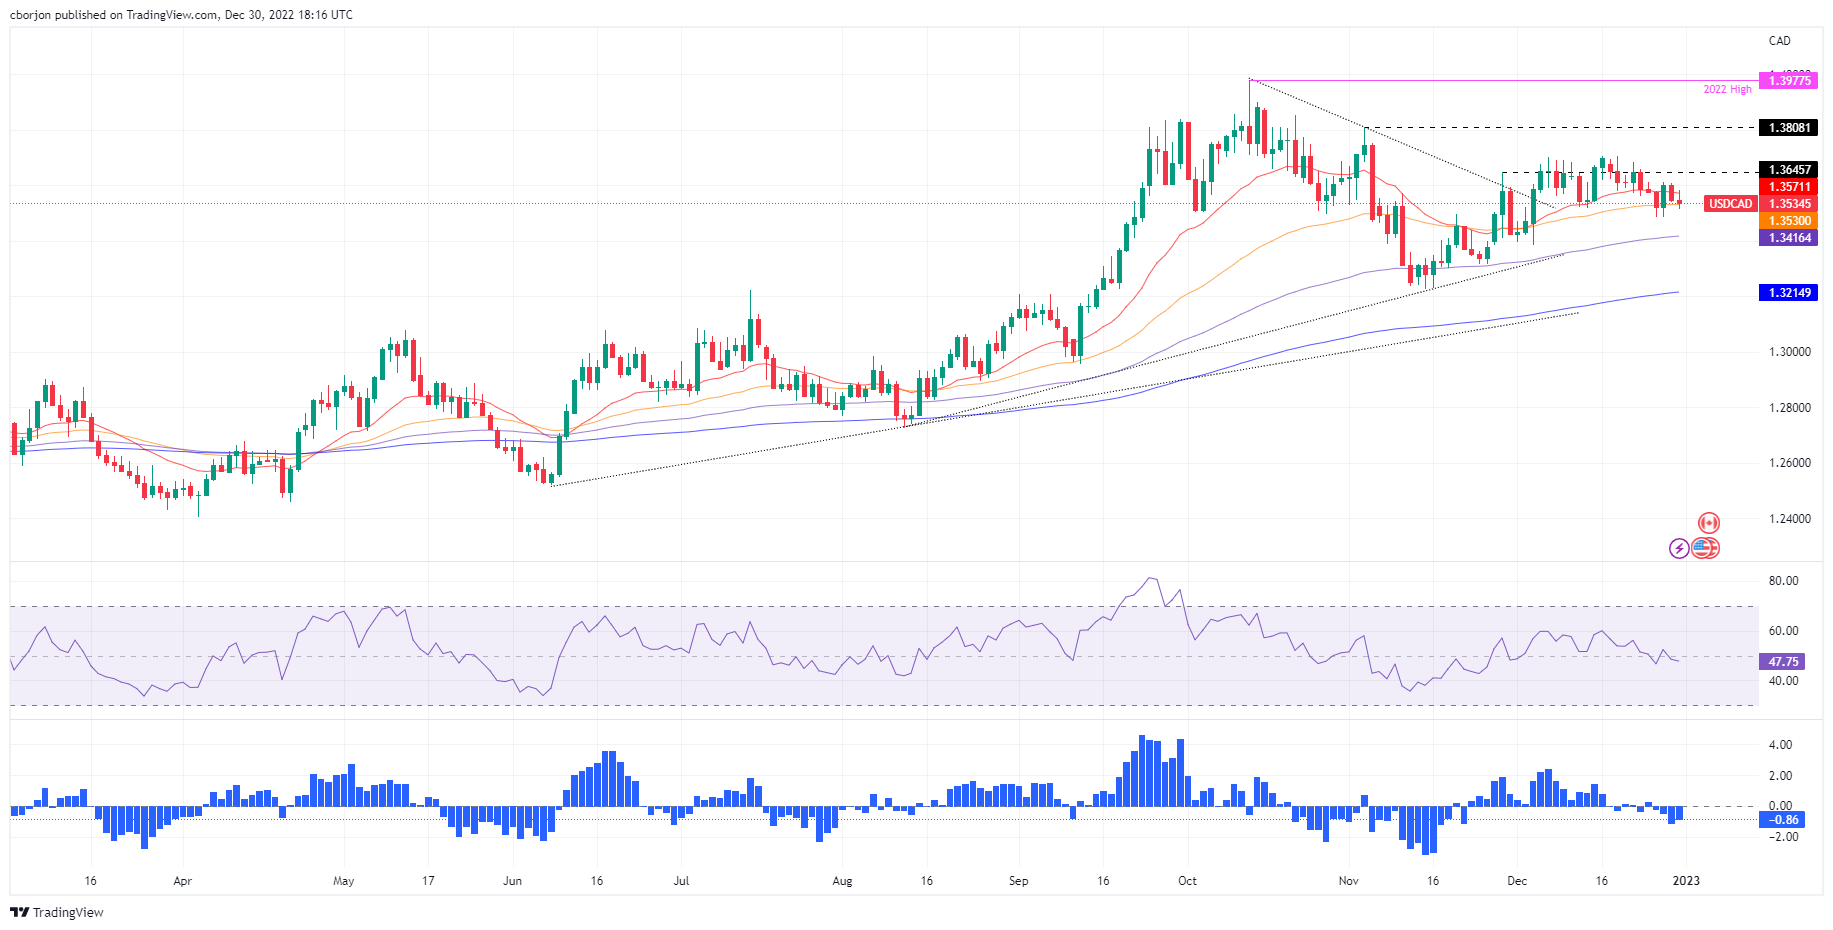
The USD/CAD advance stalled at the 20-day Exponential Moving Average (EMA) at 1.3570 and dropped toward the 50-day EMA as the US Dollar (USD) weakened, while crude oil extended its recovery, a tailwind for the Canadian Dollar (CAD). At the time of writing, the USD/CAD is trading at 1.3530.
USD/CAD Price Analysis: Technical outlook
From a daily chart perspective, the USD/CAD dropped to fresh two-day lows but shy of the weekly low of 1.3484. During the last five trading days, the 20-day Exponential Moving Average (EMA), around 1.3570, capped the USD/CAD recovery towards the 1.3700 figure. And since mid-December, the USD/CAD embarked on successive series of lower highs/lows as the major consolidated ahead of the year’s end.
The Relative Strength Index (RSI), at bearish territory, keeps USD/CAD sellers hopeful for further downside, while the Rate of Change (RoC), suggests selling pressure is waning. Therefore, unless the USD/CAD decisively breaks below 1.3484, that could open the door for further losses. The next support would be the 100-day EMA at 1.3416, ahead of the 1.3400 figure, and the 200-day EMA at 1.3215.
As an alternative scenario, the USD/CAD first resistance would be the 20-day EMA at 1.3570. Once cleared, the next resistance would be 1.3600, followed by the 1.3700 mark.
USD/CAD Key Technical Levels
USD/CAD
| Overview | |
|---|---|
| Today last price | 1.353 |
| Today Daily Change | -0.0013 |
| Today Daily Change % | -0.10 |
| Today daily open | 1.3543 |
| Trends | |
|---|---|
| Daily SMA20 | 1.3604 |
| Daily SMA50 | 1.3529 |
| Daily SMA100 | 1.3437 |
| Daily SMA200 | 1.3116 |
| Levels | |
|---|---|
| Previous Daily High | 1.3611 |
| Previous Daily Low | 1.3538 |
| Previous Weekly High | 1.3704 |
| Previous Weekly Low | 1.3563 |
| Previous Monthly High | 1.3808 |
| Previous Monthly Low | 1.3226 |
| Daily Fibonacci 38.2% | 1.3566 |
| Daily Fibonacci 61.8% | 1.3583 |
| Daily Pivot Point S1 | 1.3517 |
| Daily Pivot Point S2 | 1.3491 |
| Daily Pivot Point S3 | 1.3444 |
| Daily Pivot Point R1 | 1.359 |
| Daily Pivot Point R2 | 1.3637 |
| Daily Pivot Point R3 | 1.3663 |
Forex News
Keep up with the financial markets, know what's happening and what is affecting the markets with our latest market updates. Analyze market movers, trends and build your trading strategies accordingly.
