
GBP/JPY Price Analysis: Stalls in narrow range above the 192.00 threshold
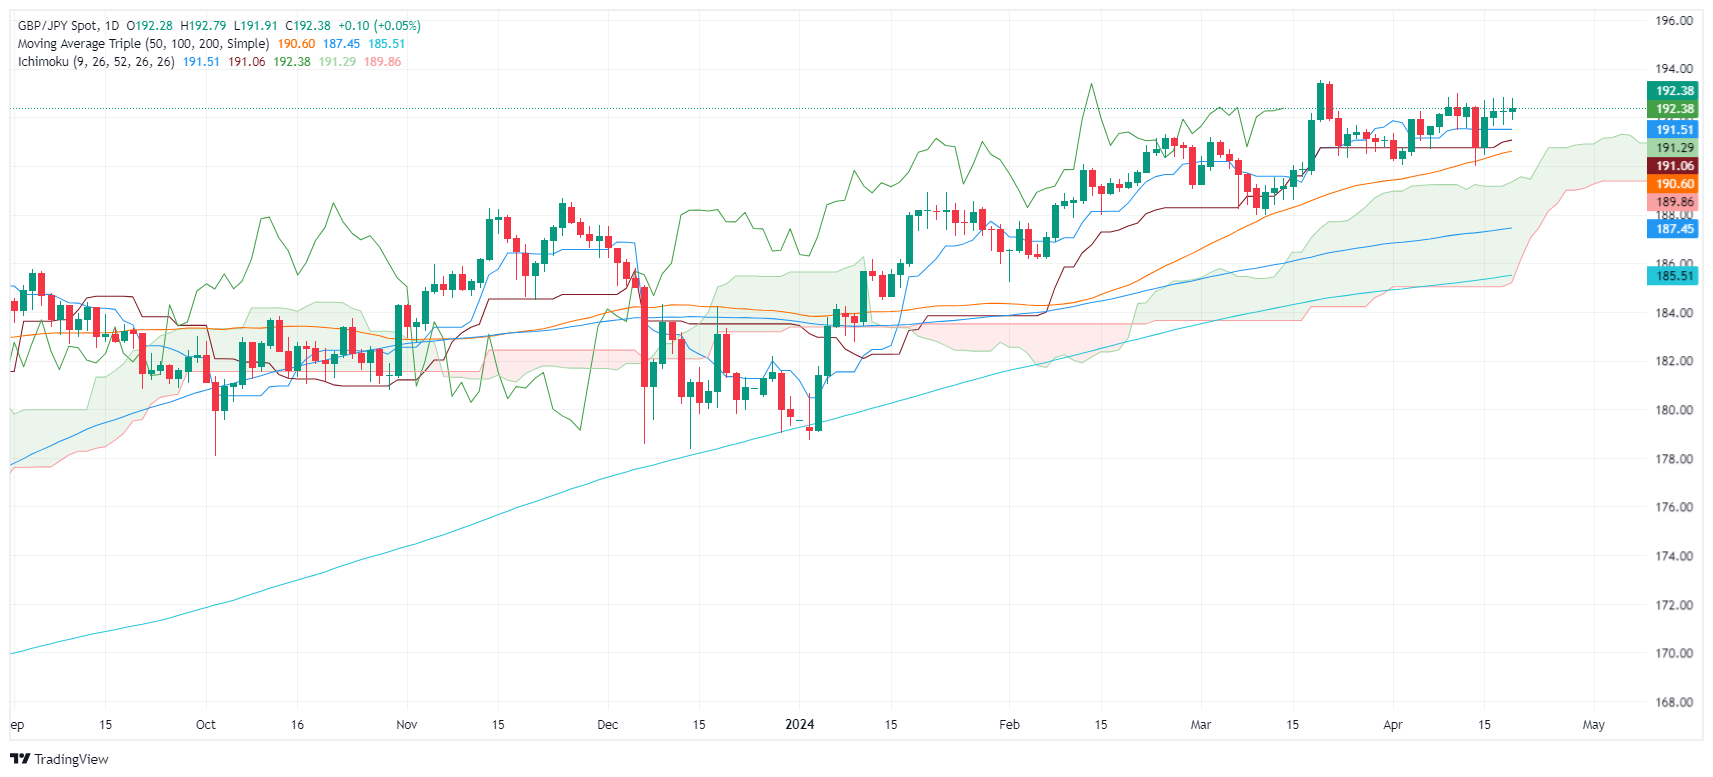
- GBP/JPY slightly rises, within a 191.90/192.80 trading range.
- Positioned above the Ichimoku Cloud, technical indicators favor a bullish outlook, though signs of consolidation are evident.
- A breakout above 192.80 could lead to testing resistance at 193.00 and potentially reaching the year-to-date high of 193.54.
The GBP/JPY is flatlined for the second consecutive day, hovering around 192.30, clocking minimal gains of 0.05%. The cross-pair remains unable to crack the 191.90/192.80 range for the third straight day amid fears of Japanese authorities' intervention.
GBP/JPY Price Analysis: Technical outlook
The GBP/JPY remains above the Ichimoku Cloud (Kumo), suggesting the pair is bullish. However, it is consolidating as the distance between the Senkou Span A and B shrank, the same case with the Tenkan and Kijun-Sen levels, standing beneath the price action, at 191.46 and 191.06, respectively.
If the pair slips below 192.00, the Tenkan and Kijun Sen levels will be exposed. Further losses are seen if the cross tumbles below the confluence of an upslope support trendline and the 50-day moving average (DMA) at 190.55.
On the flip side, a break above resistance, seen at 192.80, could signal a continuation of the uptrend. The first supply zone to challenge would be 193.00, followed by the year-to-date (YTD) high at 193.54.
GBP/JPY Price Action – Daily Chart
Forex News
Keep up with the financial markets, know what's happening and what is affecting the markets with our latest market updates. Analyze market movers, trends and build your trading strategies accordingly.