
Traders are always looking for ways to profit from market trends. You can take advantage of markets' most essential tendencies by following trendlines, breakouts, and mean reversions.
Trading indicators help us quantify and define the market's behaviour reliably and consistently in this process. Trend-following indicators allow you to objectively monitor and assess market behaviour rather than rely on your abilities. Obviously, you must form a trading strategy based on these signals. Still, it's not wrong to say that they help remove biases from your trading.
We're going to look closer at the five best trend-following indicators that can be used to either measure the strength of a trend or its direction.
Suggested read: What is time frame in trading
Moving averages
There is probably no trading indicator more well-known than the moving average. Because it is so simple, it was one of the first technical indicators used by technicians before computerized trading platforms became available.
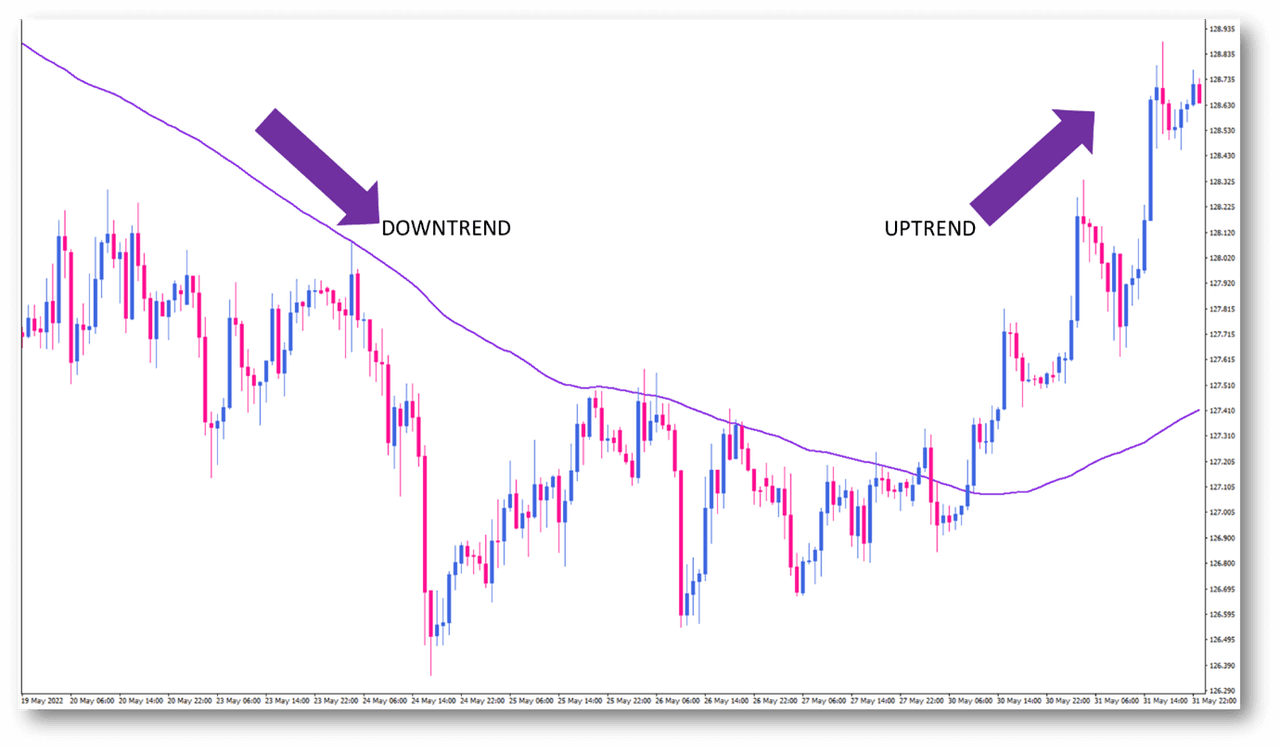
The most common approach in trading with moving averages assumes that an uptrend exists if the average slopes upward and the price is above it. In contrast, a downtrend would require the opposite conditions. A 200-period moving average is often used when determining the general direction of a trend using moving averages.
A crossover signal can also be generated by combining two moving averages or more. There are numerous examples of crossovers between moving averages. Still, one of the most well-known is when the 50-period moving average crosses over the 200-period moving average, called a golden cross.
There are many more types of moving averages besides the simple moving average. Other types of moving averages give each datapoint a different weighting depending on how far back it is. The exponential moving average and linear-weighted moving average are great examples of this. Other than that, other less-known averages take other factors into their calculation. Among them is a volume-weighted moving average, which calculates how much weight to give every historical closing price based on volume.
Moving Average Convergence Divergence, MACD
The MACD, or Moving Average Convergence Divergence, is a trend-following indicator that attempts to capture market momentum. It creates a momentum oscillator out of two exponential moving averages to accomplish this. Short-term momentum is assessed as being stronger or weaker compared to a long-term trend by subtracting the shorter moving average from the longer moving average.
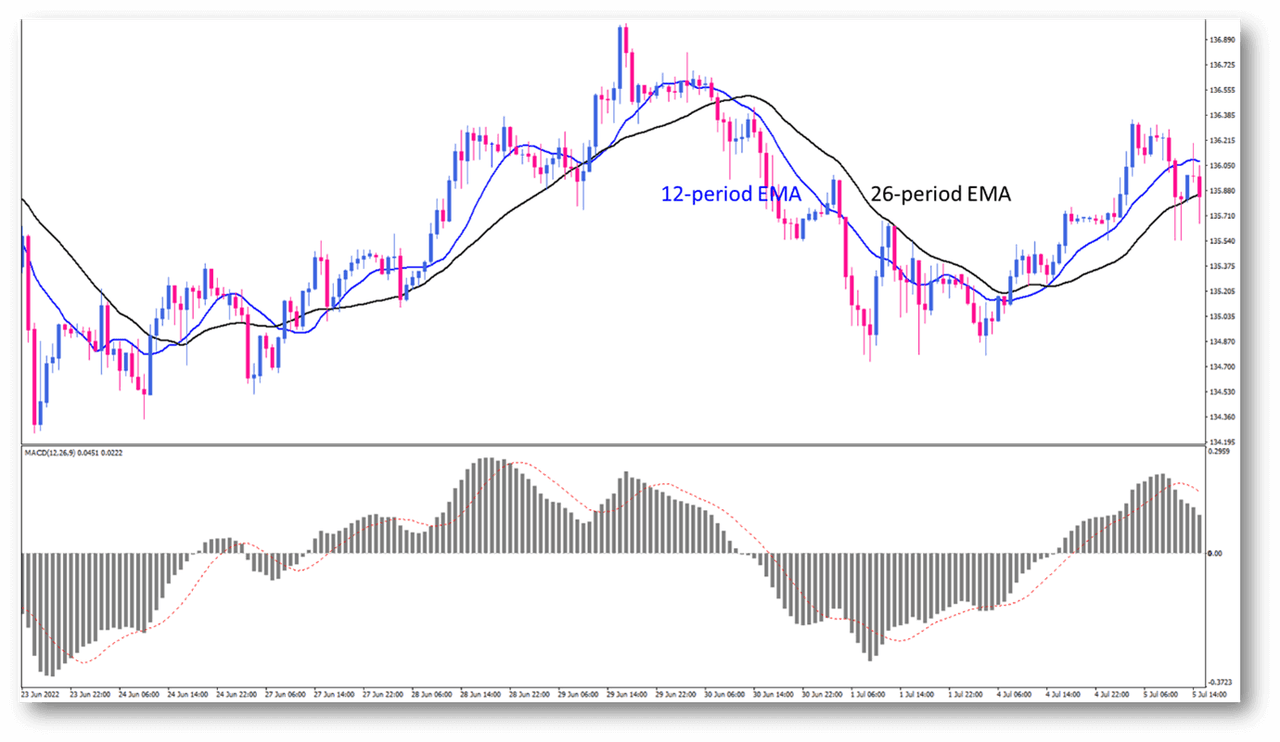
The MACD Indicator is composed of four parts, which we will briefly discuss in order to make it easier to understand
1. The MACD histogram
The MACD line is the difference between the 12-period and 26-period exponential moving averages and is the most important part of the indicator.
If you want to understand how the market's movements would influence the MACD line, think of an uptrend. We learned that a confirmed uptrend has two conditions. The shorter EMA is above, the longer EMA, and the price is above both. Therefore, the MACD has a positive reading. In the event of a sudden upswing, the short-term average would rise sharply, whereas the longer-term average would not respond as quickly. Therefore, the MACD line would rise as the difference between the two EMA increased.
The results are pretty similar in the case of a downtrend but in the opposite direction.
We know that a confirmed downtrend has two conditions. The shorter EMA is below, the longer EMA and the price is below both. Therefore, the MACD has a negative reading. In the event of a sudden decline, the short-term average would fall sharply, whereas the longer-term average would not respond as quickly. Therefore, the MACD line would fall as the difference between the two EMA increased.
2. Signal Line
A signal line is simply an exponential moving average of the MACD line. As such, you might call it a lagging MACD line. The signal line is typically set to 9-period exponential moving averages as the default setting.
Combined with the MACD line, the signal line provides reversal signals, which appear when the MACD line crosses over the signal line.
Suggested read: Trading signals
3. The Base Line (Zero Line)
The baseline is a line drawn at the point where the MACD line changes from a negative to a positive reading and is commonly referred to as the zero-line. In general, positive MACD values indicate a bullish market, and negative MACD values reflect a bearish one.
Average Directional Index, ADX
Average Directional Index, or ADX, measures the strength of a trend regardless of its direction. A reading below 20 usually indicates a weak trend. In contrast, a reading above 25 indicates a strong trend that could continue for a while.
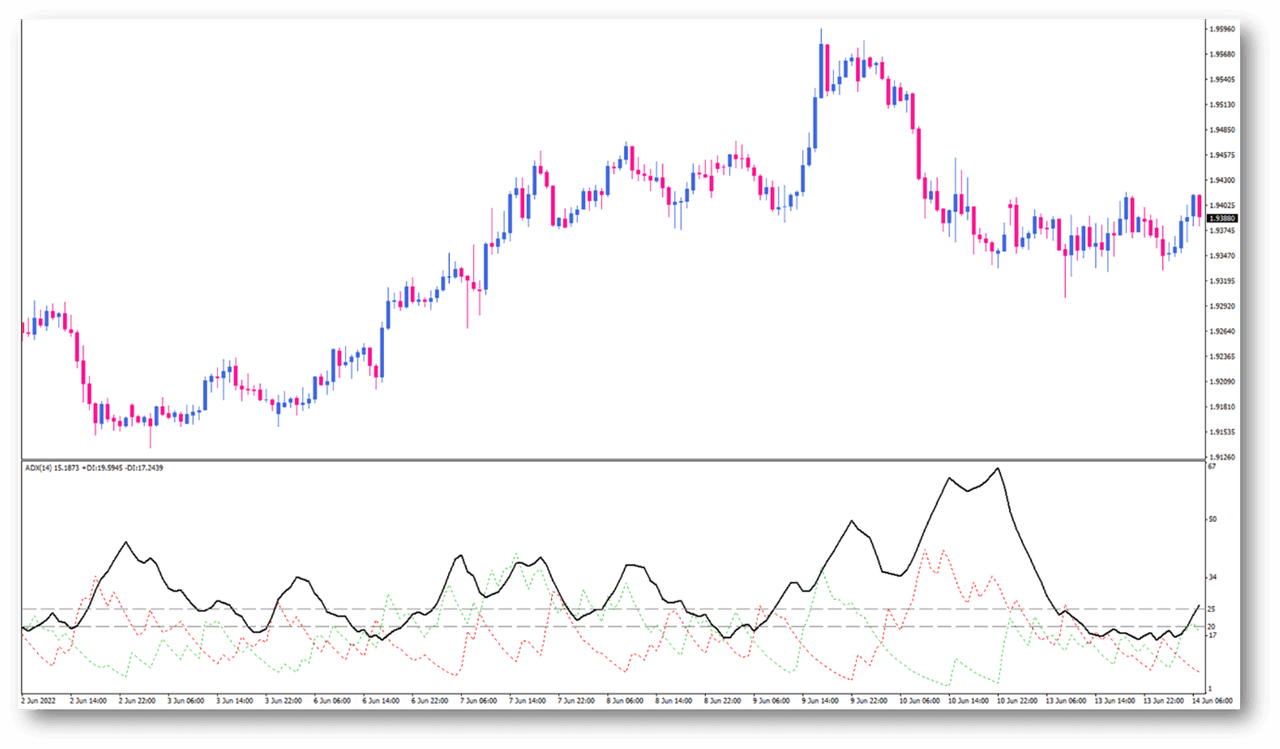
Among our favourite trading indicators, ADX works very well on many markets and trading strategies. Adding an ADX filter and choosing to take trades only under high or low volatility can significantly improve any trend-following strategy.
As a default, it is set to 14 periods, but we have found that it works well with many other settings that target various indicator lengths. For example, if you use 5-period ADX, you can gauge short-term trend strength, whereas if you use 20-period, you can gauge long-term trend strength. Depending on the characteristics of the strategy you are using, all of these factors can relate to that strategy.
Parabolic SAR
A Parabolic SAR is a trend-following indicator used primarily to determine when a trend is worth entering based on the price direction. Interestingly, its inventor, J.Welles Wilder, also invented the well-known Relative Strength Index, which we will cover in this article.
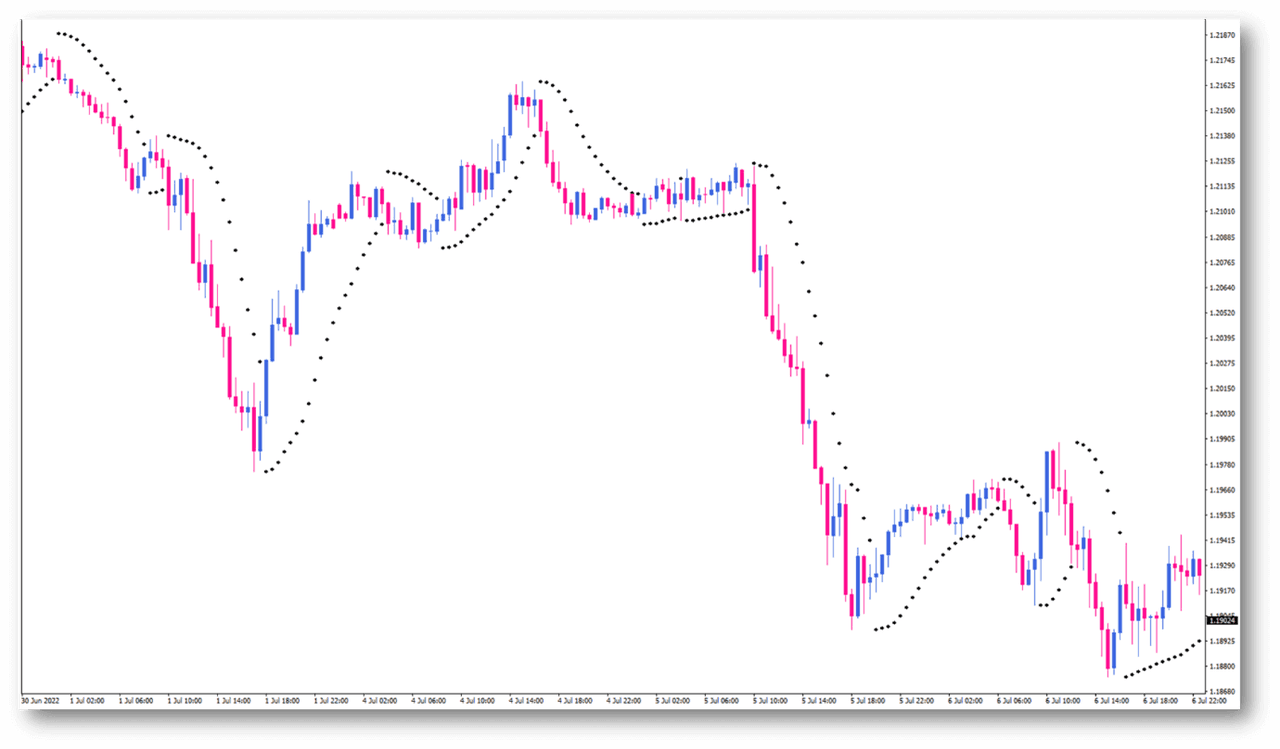
When it comes to the appearance of the parabolic SAR on a chart, it differs slightly from that of many other indicators. Unlike other indicators that show a line on or below the chart, the Parabolic SAR offers a series of dots. Generally, dots placed below the price are considered bullish signals, while dots above the price are considered bearish signals.
Essentially, when the dots start to change their position relative to the price, it indicates that the direction of the trend might be changing. As the prices turn around, the Parabolic SAR's position changes.
Suggested read: What are Pivot Points
Relative Strength Index (RSI)
A relative strength index is one of the most popular trading indicators we use in our trading. It can be used in many different types of trading, including trend-following and mean reversion trading.
The RSI is calculated by comparing the strength of recent up-moves with that of recent down-moves. It then provides readings between 0 and 100, with readings above 70 and below 30 considered extremes.
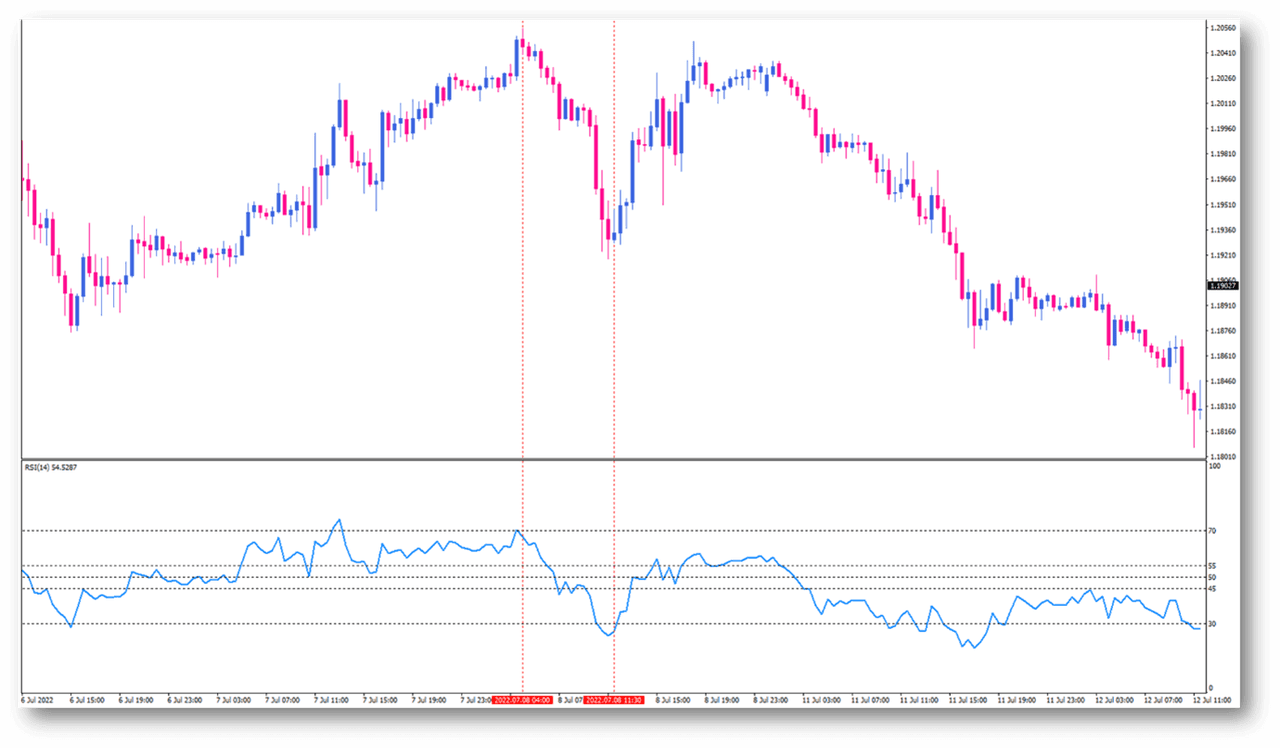
As soon as the RSI goes through a particular threshold value, many traders anticipate a reversal in the market. The market may reverse its move upside in the short term if the RSI falls below the 30-level, indicating exhaustion of sellers. Vice versa, if the RSI reading reaches the 70-level and beyond, that would be an indication of an overbought situation, hinting at a probable bearish reversal. However, that's not the only reason to use the RSI.
In addition to serving as a powerful mean reversion indicator, it can also be used to identify strong trends in the current market. A high reading above 50 is regarded as a sign of an ongoing uptrend rather than an alarming sign of upcoming price declines. In contrast, a low reading below 50 is viewed as a sign of a steady downtrend rather than an ominous sign of impending reversal.
Related articles
 ForexInveslo
What is the Consumer Price Index (CPI)?
The Consumer Price Index (CPI) tracks the average change over time in prices consumers pay for a representative basket of goods and services. It is one of the main measures used to monitor consumer inflation.
 ForexInveslo
What is a Trading Journal & How Do Traders Use It?
A trader can remember a big winner for months and forget three poorly planned trades from the same week. That is one reason relying on memory makes trade review difficult.
 ForexInveslo
Slippage in Trading: What it is and How to Reduce it?
Slippage in trading costs most retail traders more than they realise, and it's rarely discussed until after the damage is done. You place an order at one price, it fills at another, and suddenly your trade is already underwater before the market's moved a tick against you. It happens fast.