Skip to content
  • Partners

Instruments

  • Forex Trading
  • Spot Metals
  • Spot Energies
  • CFD Indices

Social

  • Copy Trading

Accounts

  • Accounts Overview
  • Standard
  • ECN Commission Free
  • ECN
  • Inveslo Premium
  • Demo Trading Account

Conditions

  • Leverage and Margin
  • Contract Specifications
  • Payment Methods

Platforms

  • MetaTrader 4
  • MetaTrader 5

Knowledge Hub

  • Blog
  • Trading Schedule
  • Trading Tools

Trading Tools

  • Pip Calculator
  • Margin Calculator
  • Profit Calculator
  • Trading Calculator
  • World Clock

About Us

  • Who we are
  • Company News
  • Financial Commission Certified
  • License and Certification
  • Contact Us
LoginRegister
Register
Menu
  • Instruments

    • Forex Trading
    • Spot Metals
    • Spot Energies
    • CFD Indices

    Social

    • Copy Trading
  • Accounts

    • Accounts Overview
    • Standard
    • ECN Commission Free
    • ECN
    • Inveslo Premium
    • Demo Trading Account

    Conditions

    • Leverage and Margin
    • Contract Specifications
    • Payment Methods

    Platforms

    • MetaTrader 4
    • MetaTrader 5
  • Knowledge Hub

    • Blog
    • Trading Schedule
    • Trading Tools

    Trading Tools

    • Pip Calculator
    • Margin Calculator
    • Profit Calculator
    • Trading Calculator
    • World Clock
  • About Us

    • Who we are
    • Company News
    • Financial Commission Certified
    • License and Certification
    • Contact Us
  • Partners
LoginRegister
  • Partners

Instruments

  • Forex Trading
  • Spot Metals
  • Spot Energies
  • CFD Indices

Social

  • Copy Trading

Accounts

  • Accounts Overview
  • Standard
  • ECN Commission Free
  • ECN
  • Inveslo Premium
  • Demo Trading Account

Conditions

  • Leverage and Margin
  • Contract Specifications
  • Payment Methods

Platforms

  • MetaTrader 4
  • MetaTrader 5

Knowledge Hub

  • Blog
  • Trading Schedule
  • Trading Tools

Trading Tools

  • Pip Calculator
  • Margin Calculator
  • Profit Calculator
  • Trading Calculator
  • World Clock

About Us

  • Who we are
  • Company News
  • Financial Commission Certified
  • License and Certification
  • Contact Us
  • English
  • Español
  • Português
  • فارسی
  • Tiếng Việt
Register
Menu
  • Instruments

    • Forex Trading
    • Spot Metals
    • Spot Energies
    • CFD Indices

    Social

    • Copy Trading
  • Accounts

    • Accounts Overview
    • Standard
    • ECN Commission Free
    • ECN
    • Inveslo Premium
    • Demo Trading Account

    Conditions

    • Leverage and Margin
    • Contract Specifications
    • Payment Methods

    Platforms

    • MetaTrader 4
    • MetaTrader 5
  • Knowledge Hub

    • Blog
    • Trading Schedule
    • Trading Tools

    Trading Tools

    • Pip Calculator
    • Margin Calculator
    • Profit Calculator
    • Trading Calculator
    • World Clock
  • About Us

    • Who we are
    • Company News
    • Financial Commission Certified
    • License and Certification
    • Contact Us
  • Partners
LoginRegister

Language

  • English
  • Español
  • Português
  • فارسی
  • Tiếng Việt
  1. Home
  2. Blog
  3. Forex
  4. What is time frame in trading & know the time frame trading strategy

Forex

What is time frame in trading & know the time frame trading strategy

IBy InvesloPublished: 26 October 2022Updated 18 May 20237 min read
time frames in forex trading
On this page

On this page

  1. What Are Time Frames?
  2. Importance of Time Frames in Trading
  3. Determining the Best Time Frames for Trading Strategies
  4. How to find the Best Entry using different Timeframes
  5. How do longer time frames differ from shorter time frames?

On this page

  1. What Are Time Frames?
  2. Importance of Time Frames in Trading
  3. Determining the Best Time Frames for Trading Strategies
  4. How to find the Best Entry using different Timeframes
  5. How do longer time frames differ from shorter time frames?

Share

  • Share on X
  • Share on LinkedIn
  • Share on Facebook
  • Share on Telegram
  • Share on WhatsApp

Time frames are crucial in trading for analyzing price movements and making informed decisions. They represent specific periods, ranging from seconds to weeks, during which traders observe and assess market trends. By utilizing different time frames, traders enhance their trading strategies. In this article, we will explore the significance of time frames, determine the best time frames for trading strategies, and emphasize the importance of multiple time frame analysis.

What Are Time Frames?

Time frames indicate the duration of price fluctuations. They help traders analyze trends and patterns within specific periods. For example, minute-based time frames focus on movements within each minute. The choice of time frame is essential for relevant market analysis.

Importance of Time Frames in Trading

Selecting the appropriate time frame filters out irrelevant price movements and provides traders with essential information. Time frames help identify trends and make timely decisions.

Determining the Best Time Frames for Trading Strategies

The optimal time frames depend on the assets and trading strategies employed:

  1. Scalping: Traders aiming for small price movements in a short time commonly use time frames of 1 to 15 minutes, with 1-2 minutes being prevalent.
  2. Day Trading: Traders opening and closing positions within a day typically analyze 60-minute time frames for primary trend analysis and shorter time frames (15 to 60 minutes) for short-term trends.
  3. Swing Trading: Traders capturing medium-term trends hold positions for several days to weeks and often rely on four-hour time frames.
  4. Position Trading: Traders holding positions for longer periods use daily and weekly time frames to evaluate trends.

How to find the Best Entry using different Timeframes

There are many different timeframes that you can choose from when it comes to the forex market. Depending on the platform you use, you may also be able to set your own custom timeframe. A variety of standard timeframes can be found on the MT4 platform, which is one of the most popular platforms available. It consists of 1M, 5M, 15M, 30M, 1H, and 4H, as well as Daily, Weekly, and Monthly.

Having said that, what exactly is the difference between all the different timeframes? If I say, for example, that I am using a 4-hour timeframe (H4) for analysis, what does that mean? It simply means a candlestick that is made within a period of 4 hours. In different ways, different timeframes are suitable for different traders. In order to scalp trades with shorter timeframes, such as those spanning from five minutes to one hour, one must also be able to take intra-day trades with one-hour and four-hour timeframes during the day.

As a rule of thumb, it is critical to keep in mind that the shorter the timeframe, the longer you will need to spend watching the charts, as quick volatility can also result in more noise in the market if we are exposed to it. Larger timeframes such as the daily and the H4 would be more suitable for traders who wish to make longer-term trades, such as long-term positions.

In total, there are four different timeframes. In order to understand the daily chart better, let's take a look at it. The week is divided into seven days, so in order to form a weekly candlestick on the daily chart, you have to have seven candlesticks on the daily chart. The daily timeframe has 24 hours, and if you do the math, 24 / 4 = 6, which means you are going to see six candlesticks in the H4 timeframe before the period ends. We all know there are 24 hours in a day, so on a daily basis, you will have 24 candlesticks on the H1 timeframe.

Generally, there are three types of time frames:

Long-term – Monthly, Weekly, and Daily.

Med-term – 4-hour, 1-hour

Short-term – 30-min, 15-min, 5-min and the 1-min

How do longer time frames differ from shorter time frames?

Shorter time frames generally show more movement than longer ones since one candlestick takes a shorter time to complete. This results in more market "noise" in a shorter timeframe.

Alternatively, if you are looking for more trade opportunities rather than a larger timeframe, shorter timeframes will give us more trade setups since the candlesticks will appear more frequently compared to a larger timeframe, making it easier to trade.

As an alternative, we would like to emphasize that there is a possibility that indicators or oscillators that are based on shorter time frames may not be as accurate as those that are based on longer time frames, and trends that are based on shorter time frames may not be as meaningful as trends based on longer time frames.

The most effective way to ride the trend is to start by analyzing trends from a higher time frame (Monthly, Weekly, or Daily) to a lower time frame. There is a method of trading that is commonly referred to as the "top-down" approach in which traders evaluate the higher time frame first in order to determine the direction of a trade before moving on to the lower time frame to look for entry points.

Using the top-down approach we mentioned earlier, in this section, we will look at the example of EURUSD to see how we can combine different timeframes by using the top-down approach to combine them.

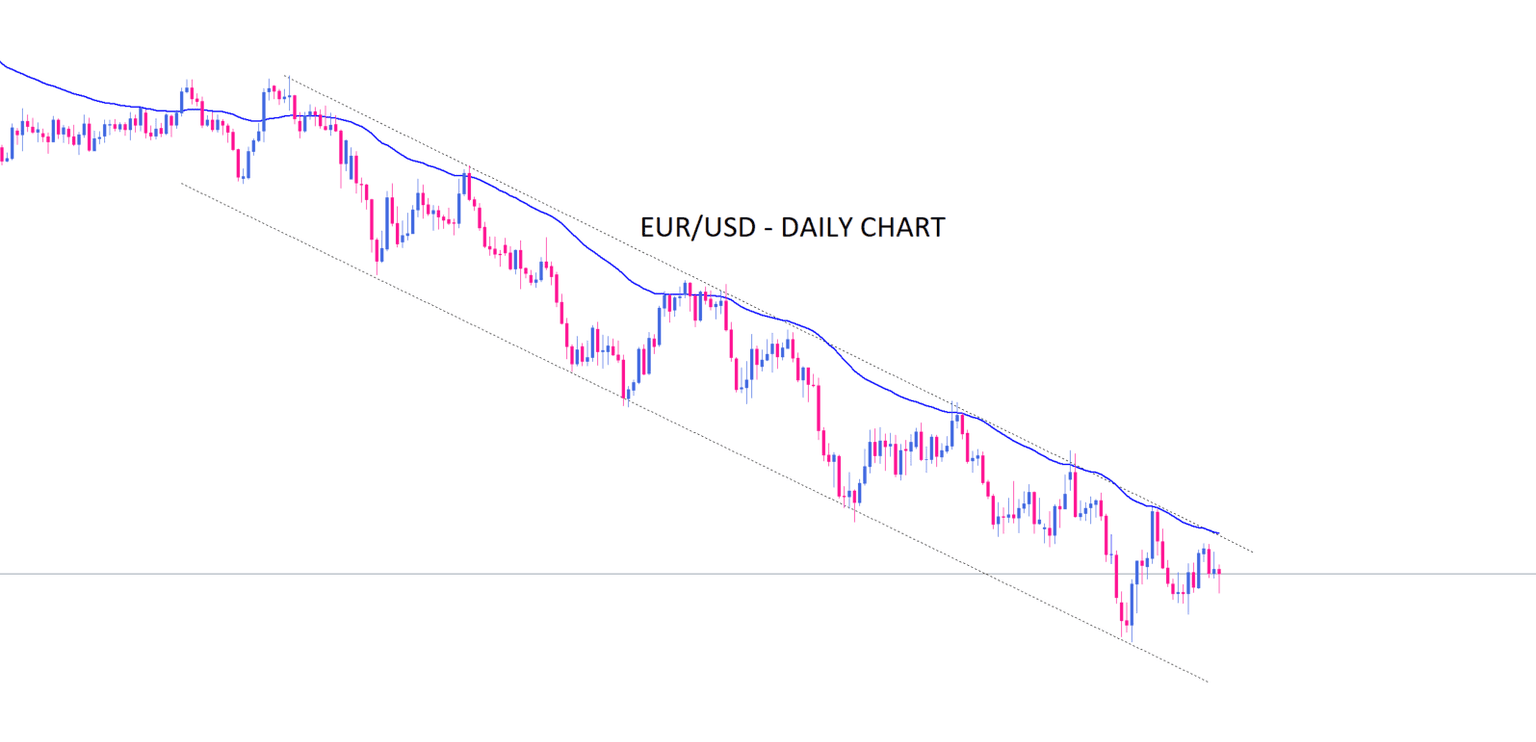
As a starting point, let's examine the EURUSD Daily chart:
Chart, histogram

Description automatically generated

As seen on the chart, a clear downtrend can be identified as the price has been making lower tops and lower bottoms, trending down below the 50-day exponential moving average. Also, a clear descending channel can be drawn. We know from technical analysis that the channel upper line serves as a dynamic resistance and the lower line acts as a dynamic support line. On the daily time frame, the market has tested and held both lines nicely. Then we will move down into a shorter time frame to look for confirmation or more signals to prove our directional bias.

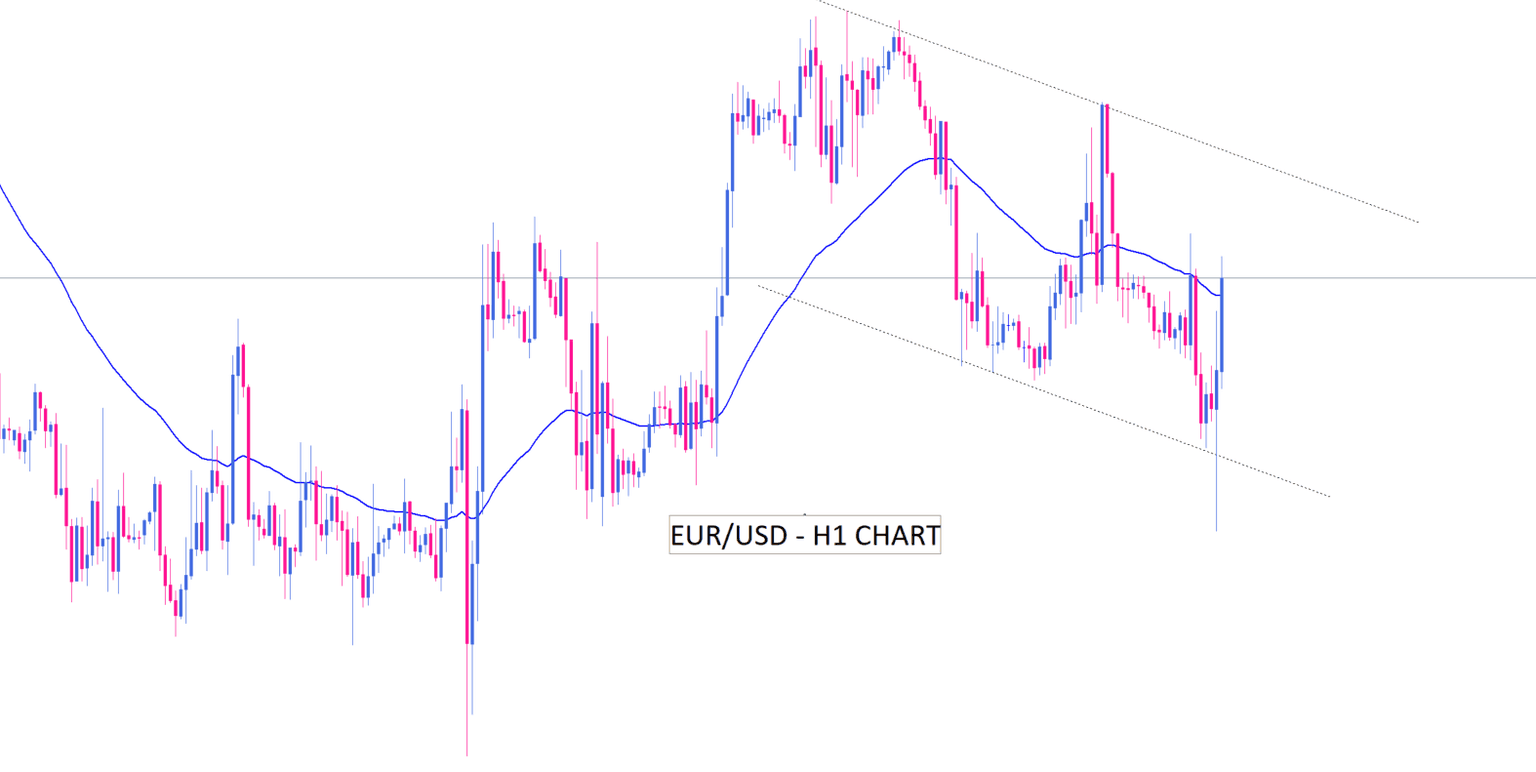
Next, let us look at the EURUSD H1 chart:
Graphical user interface, chart, histogram

Description automatically generated

When we look at EURUSD in the H1 time frame, we manage to find another short-term falling channel. Apart from the long bullish candlestick, we can see that the level that the price tested with a small pullback before pushing higher was the channel lower line, and the price is on its way to moving higher towards the channel upper line.

Now, let us pause and think for a bit. Price has tested and bounced away from the daily timeframe resistance level and is moving up in the lower timeframe. Hence, the downtrend is still strong but the price is in a corrective move in the short term. Hence, it is best to wait for a bounce back from the dynamic resistance before entering the market.

As a result, there is now more confirmation that this is a reliable downtrend to ride on, and you can definitely enter the trade with confidence at this point.

You can use a variety of timeframes for trading purposes, and this is just one of the many methods for doing so. Indicators, oscillators, and moving averages can also be applied from a higher time frame to look for support or resistance levels. The next step will be to move into lower time frames in order to look for candlestick patterns which can be used as entry points.

It is also possible to do it the other way around as well, which is to look for candlestick patterns from a higher time frame and then move into the lower time frames. You can then use oscillators such as RSI to identify overbought and oversold areas to validate the candlestick pattern.

It is a valuable tool to learn to trade within a different timeframe because it can help you become a more profitable trader as you learn how to do it. When you find yourself getting lost in a smaller time frame, remind yourself to go back to the larger timeframe so you can see what the overall directional bias is by going back to the larger time frame.

By learning advanced lessons, you can incorporate different tools for trading with different timeframes, which will definitely increase the odds of the trade being a profitable one.

Share

  • Share on X
  • Share on LinkedIn
  • Share on Facebook
  • Share on Telegram
  • Share on WhatsApp

Related articles

  • Consumer Price Index CPI
    ForexInveslo

    What is the Consumer Price Index (CPI)?

    The Consumer Price Index (CPI) tracks the average change over time in prices consumers pay for a representative basket of goods and services. It is one of the main measures used to monitor consumer inflation.
    Read More17 September 2026
  • Trading Journal
    ForexInveslo

    What is a Trading Journal & How Do Traders Use It?

    A trader can remember a big winner for months and forget three poorly planned trades from the same week. That is one reason relying on memory makes trade review difficult.
    Read More17 September 2026
  • Slippage in Trading
    ForexInveslo

    Slippage in Trading: What it is and How to Reduce it?

    Slippage in trading costs most retail traders more than they realise, and it's rarely discussed until after the damage is done. You place an order at one price, it fills at another, and suddenly your trade is already underwater before the market's moved a tick against you. It happens fast.

    Read More11 September 2026

Your next tradestarts here

Open your free account, verify in minutes, and trade the world's markets with a broker that's on your side.

Open Free AccountTry Free Demo

Trading involves risk. Manage capital wisely.

Footer

Your gateway to the world’s markets, giving you access to global trading opportunities with a fully regulated, award-winning broker trusted by over 1M traders worldwide.

Follow us:

  • Who we are
  • Deposits & Withdrawals
  • Partners
  • Risk Disclosure
  • Accounts Overview
  • CopyTrading
  • Privacy Policy
  • Refund Policy
  • AML Policy
  • Contact Us
  • Client Agreement

Disclaimer

  • →Regulated by FSC Mauritius

    Inveslo Limited, registered in Mauritius with registration number C230595 and office at C/o Legacy Capital Ltd. Second Floor, Suite 201, The Catalyst Ebene, is regulated by the Financial Services Commission of the Republic of Mauritius. Holding an Investment Dealer License, GB25205645, Inveslo adheres to strict regulatory standards, ensuring client protection, transparency, and a secure trading environment worldwide.

  • →Kazakhstan Regulatory Accreditation

    Inveslo Trading Ltd. is incorporated in the Republic of Kazakhstan with Business Identification Number 210540039066 and has been registered as Financial Services Provider with the Ministry of Economy. The company is entitled to provide the following services to customers within and outside the Republic of Kazakhstan according to the accreditation issued by the Agency for Regulation and Development of the Financial Market of the Republic of Kazakhstan, dated 13-07-2021 and file number 16-8-09/3T-C-167: Payment Processing / e-wallets, Forex Services and Crypto Currency Services.

  • →Financial Commission Membership

    Inveslo is a member of The Financial Commission, an independent external dispute resolution (EDR) organization, allowing the company and its customers a wide range of services and membership benefits including customer protection in case of disputes, up to €20,000 per case. As a FinCom certified broker, our customers are insured for the safety of funds.

  • →Risk Warning

    Trading forex and other financial instruments involve a high level of risk and may not be suitable for all investors or traders. Traders must carefully consider their trading objectives, financial situation, risk appetite, and level of experience before stepping into margin trading with Inveslo. There a risk of losing more than the trader’s initial investment. The higher the leverage, the more the risk, which can go against you. Traders are advised to be aware of the associated risks.

  • →Intellectual Property Rights

    Any kind of unauthorized publication, duplication, or quotation from the Inveslo website, without prior consent from Inveslo, will be constituted as a violation of intellectual property rights and will be subject to litigation. This includes any unauthorized use of the brand name, logos, images, agreement, etc.

  • →Crucial Insights

    All the information on this website is solely for educational purposes and is subject to change at any given time without any prior notice. The contents mentioned on the website do not constitute investment or trading advice. Inveslo has taken measures to ensure the accuracy of the information provided on this website, however, does not guarantee it. Inveslo is not, in any way, liable for the losses that might occur directly or indirectly from the reliance on or the usage of the website’s contents.

  • →Restricted Regions

    The information in this content is not intended to be provided to residents of the USA, Canada, Haiti, Suriname, North Korea, Puerto Rico and is not intended to be distributed or used by anyone in any country or jurisdiction area, as in the country or jurisdiction.

  • →Payment Agent

    CXDT Global LTD (Cyprus), with registration number HE448937, registered office at Aiolou & Panagioti Diomidous 9 Katholiki, 3020 Limassol, Cyprus, is the payment agent processing on behalf of Inveslo Trading LTD with Business Identification Number 210540039066.

  • REGULATED & TRUSTED
  • FSC Mauritius
  • The Financial Commission
  • Negative-Balance Protection
  • Segregated Funds

Risk Warning: Trading Forex and CFDs carries a high level of risk to your capital and may not be suitable for all investors. Leverage can work against you as well as for you. Before trading, ensure you fully understand the risks involved.

© 2026 Inveslo.com - All Rights Reserved

Language

  • English
  • Español
  • Português
  • فارسی
  • Tiếng Việt