
EUR/USD Price Forecast: Sticks to gains above 1.0400; could climb further amid weaker USD
- EUR/USD regains positive traction on Monday amid the emergence of some USD selling.
- The technical setup warrants some caution before positioning for further appreciation.
- Acceptance below the 50% Fibo. level would be seen as a key trigger for bearish traders.
The EUR/USD pair attracts fresh buyers at the start of a new week and for now, seems to have snapped a three-day losing streak to over a two-week low, around the 1.0360 area touched on Friday. The momentum lifts spot prices further beyond the 1.0400 mark during the Asian session and is sponsored by a weaker US Dollar (USD).
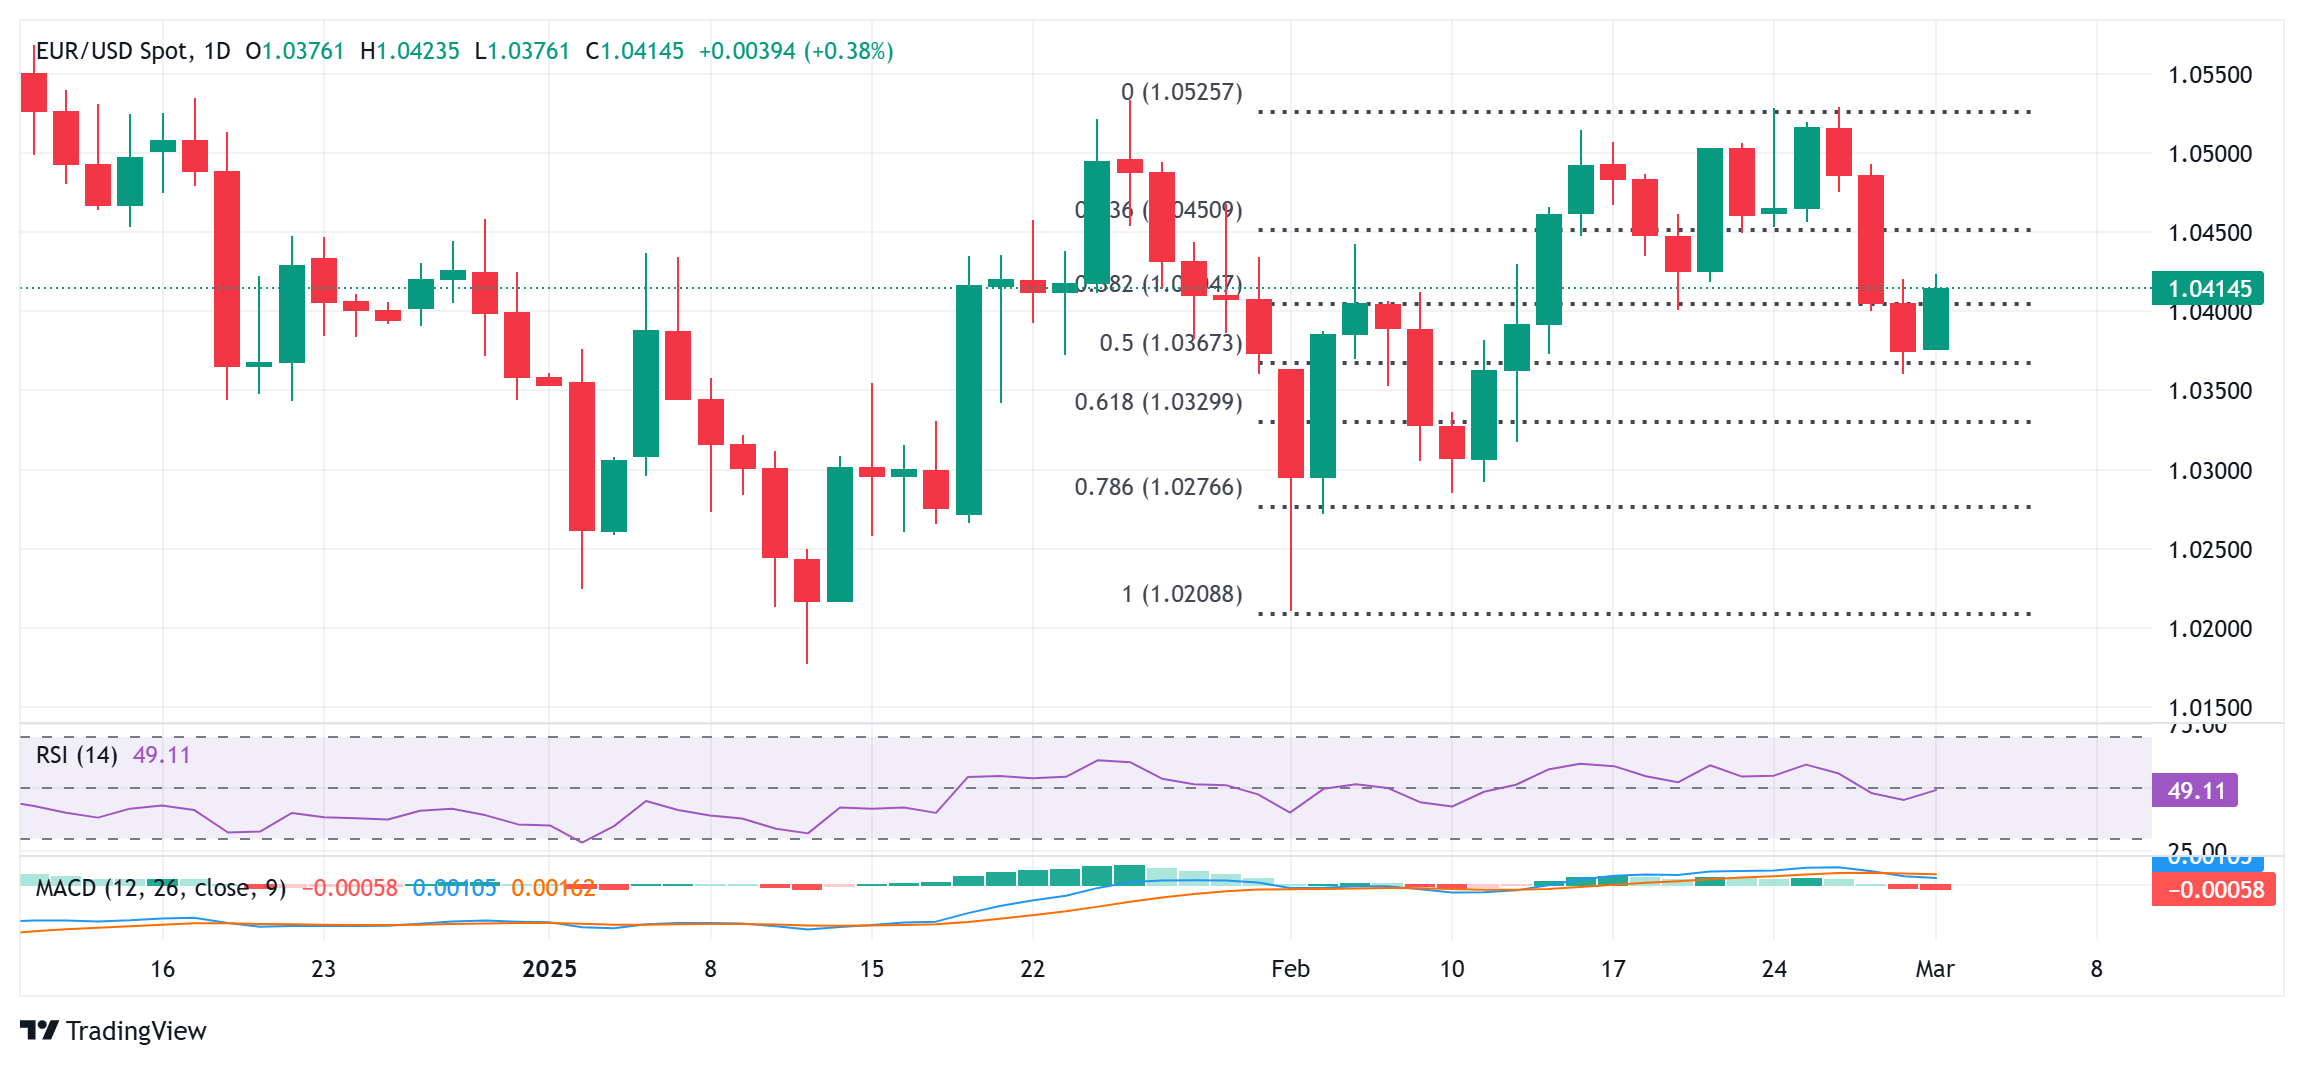
From a technical perspective, the EUR/USD pair showed some resilience below the 50% Fibonacci retracement level of the rally witnessed in February. The subsequent move above the 38.2% Fibo. level suggests that the pullback from the 1.0525-1.0530 area, or a one-month high touched last week, has run its course. The said area represents the 100-day Simple Moving Average (SMA) and should act as a key pivotal point for short-term traders.
Meanwhile, oscillators on the daily chart are yet to confirm a positive bias and warrant some caution for bullish traders amid worries about US President Donald Trump's tariff plans. Nevertheless, the EUR/USD pair still seems poised to climb further towards the 1.0450 horizontal support breakpoint, now turned resistance, which coincides with the 23.6% Fibo. level. A sustained strength beyond could lift spot prices to the 1.0500 psychological mark.
On the flip side, the 1.0370 area, or the 50% Fibo. level now seems to protect the immediate downside. Some follow-through selling could drag the EUR/USD pair to the 61.8% Fibo. level, around the 1.0330 region, en route to the 1.0300 mark and the 1.0285 support zone. The downfall could extend further towards the February swing low, around the 1.0210 region, before spot prices drop to the 1.0180-1.0175 region, or over a two-year low touched in January.
EUR/USD daily chart
US Dollar PRICE Today
The table below shows the percentage change of US Dollar (USD) against listed major currencies today. US Dollar was the strongest against the Canadian Dollar.
| USD | EUR | GBP | JPY | CAD | AUD | NZD | CHF | |
|---|---|---|---|---|---|---|---|---|
| USD | -0.37% | -0.19% | -0.11% | -0.02% | -0.17% | -0.04% | -0.08% | |
| EUR | 0.37% | 0.08% | 0.05% | 0.17% | 0.10% | 0.15% | 0.09% | |
| GBP | 0.19% | -0.08% | 0.08% | 0.09% | 0.03% | 0.08% | 0.02% | |
| JPY | 0.11% | -0.05% | -0.08% | 0.30% | -0.02% | 0.11% | -0.00% | |
| CAD | 0.02% | -0.17% | -0.09% | -0.30% | 0.00% | -0.02% | -0.08% | |
| AUD | 0.17% | -0.10% | -0.03% | 0.02% | -0.00% | 0.05% | -0.01% | |
| NZD | 0.04% | -0.15% | -0.08% | -0.11% | 0.02% | -0.05% | -0.06% | |
| CHF | 0.08% | -0.09% | -0.02% | 0.00% | 0.08% | 0.01% | 0.06% |
The heat map shows percentage changes of major currencies against each other. The base currency is picked from the left column, while the quote currency is picked from the top row. For example, if you pick the US Dollar from the left column and move along the horizontal line to the Japanese Yen, the percentage change displayed in the box will represent USD (base)/JPY (quote).
Forex News
Keep up with the financial markets, know what's happening and what is affecting the markets with our latest market updates. Analyze market movers, trends and build your trading strategies accordingly.