
Gold price holds above multi-week low set on Friday, looks to US ISM PMI for fresh impetus
- Gold price gained some positive traction on Monday amid modest US Dollar weakness.
- Bets that the Fed will cut rates again undermine the USD and benefit the XAU/USD pair.
- Concerns about Trump’s tariff plans and a global trade war also support the commodity.
Gold price (XAU/USD) struggles to build on its modest intraday gains through the early European session on Monday, though it manages to hold its neck above a three-week low touched on Friday. Traders are pricing in the possibility that the Federal Reserve (Fed) will cut interest rates by a quarter of a percentage point twice by the end of this year amid signs of deteriorating consumer sentiment. This, in turn, fails to assist the US Dollar (USD) to capitalize on a three-day-old recovery from over a two-month low touched last week and helps revive demand for the non-yielding yellow metal.
Apart from this, growing market worries about the potential economic fallout from US President Donald Trump's trade tariffs and geopolitical risks turn out to be other factors that benefit the safe-haven Gold price. That said, a generally positive tone around the equity markets keeps a lid on any further appreciating move for the bullion. Traders also seem reluctant and opt to wait for this week's important US macro releases before placing fresh directional bets. This, in turn, warrants some caution before confirming that the corrective pullback from the all-time high has run its course.
Daily Digest Market Movers: Gold price remain supported by trade war fears, weaker USD
- The US Bureau of Economic Analysis reported on Friday that the Personal Consumption Expenditures (PCE) Price Index rose 0.3% in January and increased 2.5% over the past twelve months, down slightly from 2.6% in December.
- Adding to this, the core PCE Price Index, which excludes volatile food and energy prices, gained 0.3% last month and climbed 2.6% on a yearly basis in January, marking a notable deceleration from 2.9% in the previous month.
- The report further revealed that US consumer spending unexpectedly dropped 0.2% last month, marking the first decline since March 2023 and the biggest decrease in nearly four years, fueling worries about the US growth outlook.
- According to the CME Group's FedWatch Tool, market participants are pricing in the possibility that the Federal Reserve will resume cutting interest rates at the June policy meeting and lower borrowing costs again in September.
- This comes on top of worries that US President Donald Trump's trade tariffs would undermine consumer spending and fail to assist the US Dollar to capitalize on a three-day-old recovery move from over a two-month low.
- Trump confirmed that he will impose tariffs on Canada and Mexico starting Tuesday and announced plans to double the 10% universal tariff on imports from China, raising the risk of a global trade war and benefiting the safe-haven Gold price.
- Traders now look to the US ISM Manufacturing PMI for some impetus later this Monday. Apart from this, other key US macro releases, including the Nonfarm Payrolls report on Friday, should influence the near-term USD trajectory.
Gold price bears have the upper hand; 23.6% Fibo. level support breakdown in play
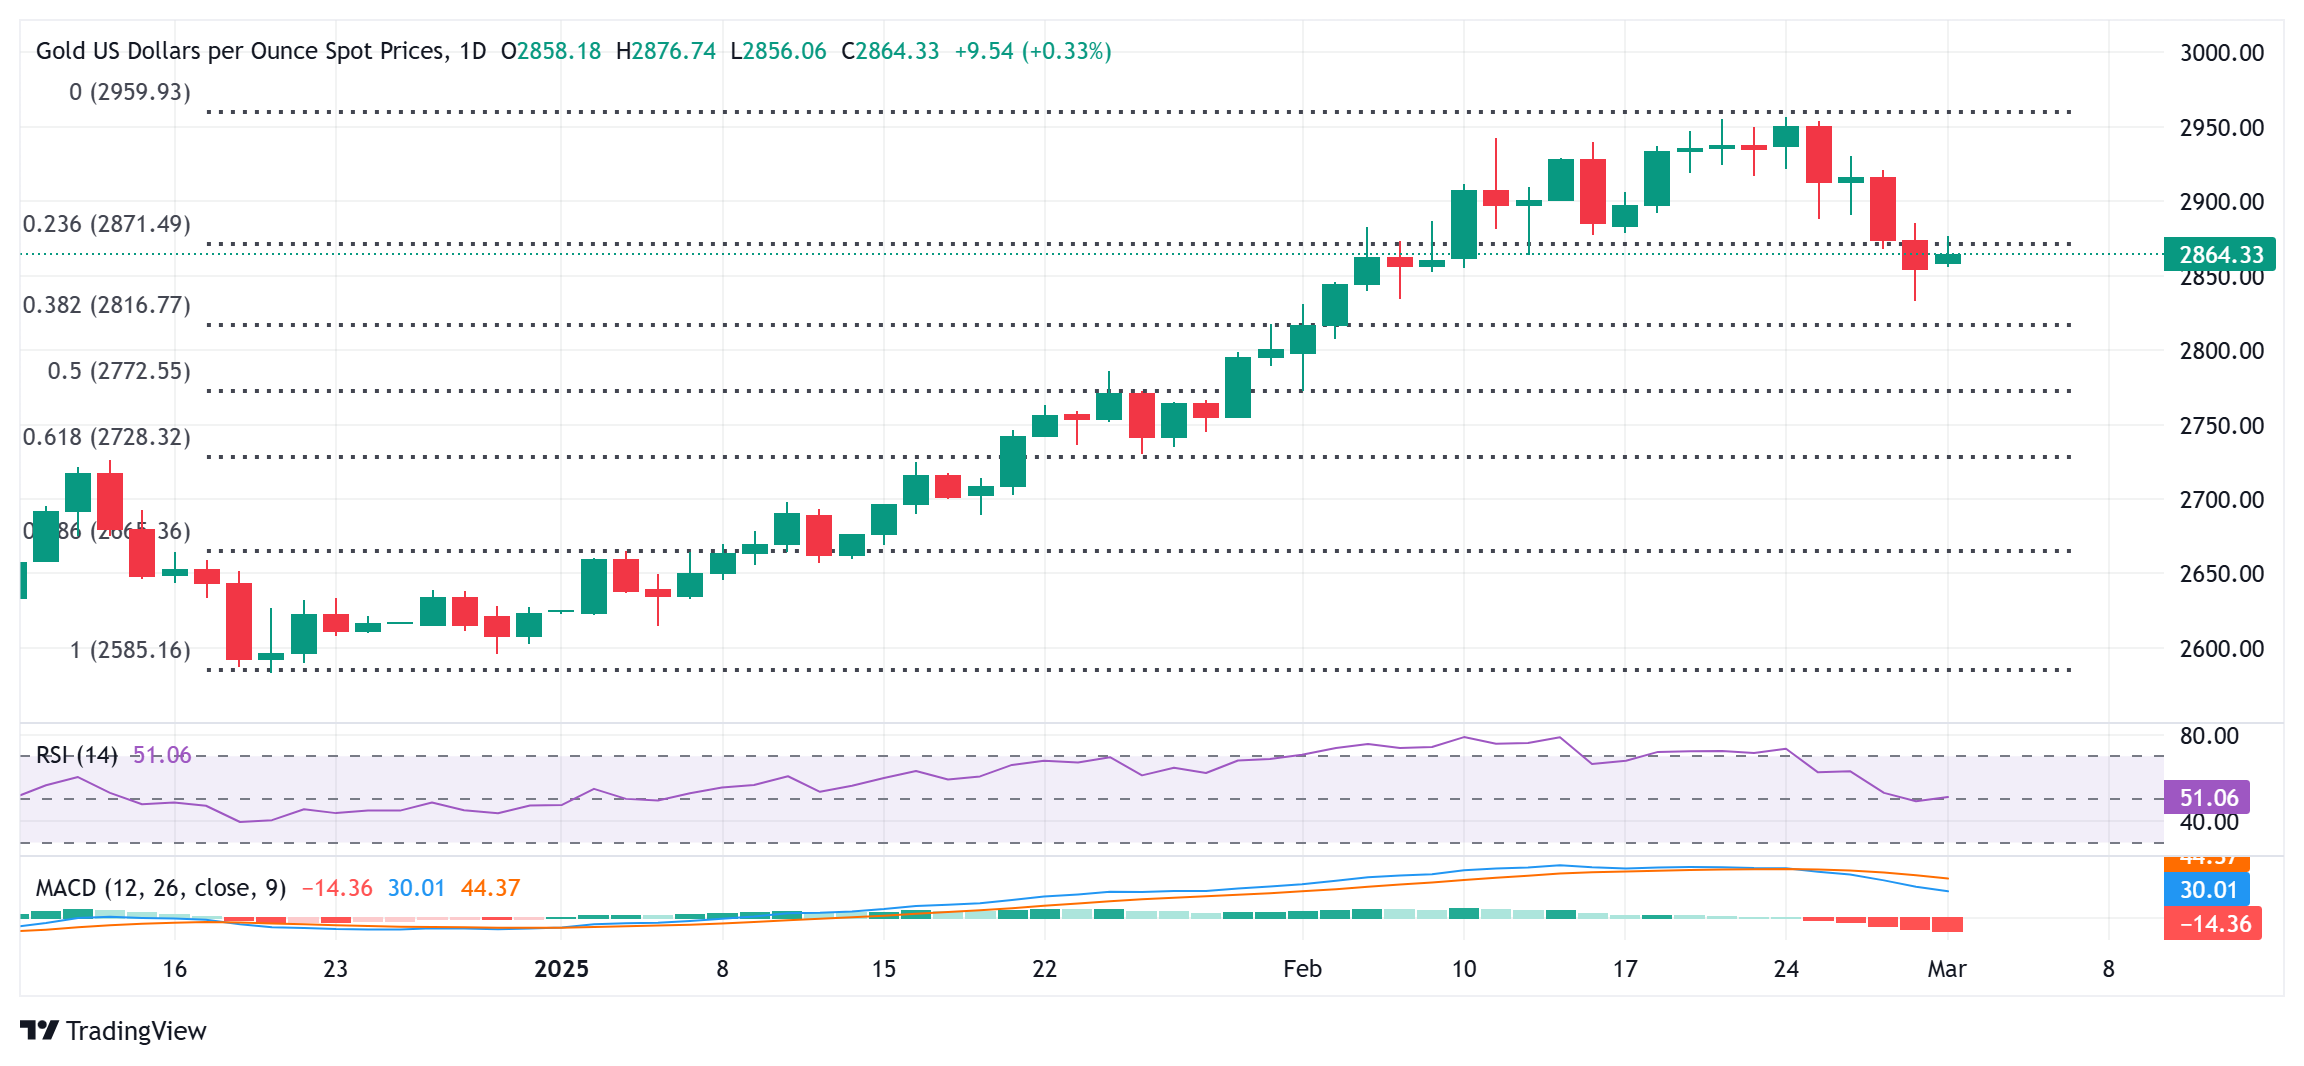
From a technical perspective, last week's breakdown below the 23.6% Fibonacci retracement level of the December-February rally was seen as a key trigger for sellers. Moreover, oscillators on the daily chart have just started gaining negative traction, and back prospects for an extension of the corrective pullback from the all-time peak.
Hence, any subsequent move up might still be seen as a selling opportunity and remain capped near the $2,885 region. This is closely followed by the $2,900 mark, above which the Gold price could climb to the $2,934 intermediate hurdle en route to the record high, around the $2,956 region.
On the flip side, Friday's swing low, around the $2,833-2,832 zone, now seems to protect the immediate downside, below which the Gold price could fall to 38.2% Fibo. level, around the $2,815-2,810 region. Some follow-through selling below the $2,800 mark would suggest that the commodity has topped out and could pave the way for deeper losses.
Economic Indicator
ISM Manufacturing PMI
The Institute for Supply Management (ISM) Manufacturing Purchasing Managers Index (PMI), released on a monthly basis, is a leading indicator gauging business activity in the US manufacturing sector. The indicator is obtained from a survey of manufacturing supply executives based on information they have collected within their respective organizations. Survey responses reflect the change, if any, in the current month compared to the previous month. A reading above 50 indicates that the manufacturing economy is generally expanding, a bullish sign for the US Dollar (USD). A reading below 50 signals that factory activity is generally declining, which is seen as bearish for USD.
Read more.Next release: Mon Mar 03, 2025 15:00
Frequency: Monthly
Consensus: 50.8
Previous: 50.9
Source: Institute for Supply Management
The Institute for Supply Management’s (ISM) Manufacturing Purchasing Managers Index (PMI) provides a reliable outlook on the state of the US manufacturing sector. A reading above 50 suggests that the business activity expanded during the survey period and vice versa. PMIs are considered to be leading indicators and could signal a shift in the economic cycle. Stronger-than-expected prints usually have a positive impact on the USD. In addition to the headline PMI, the Employment Index and the Prices Paid Index numbers are watched closely as they shine a light on the labour market and inflation.
Forex News
Keep up with the financial markets, know what's happening and what is affecting the markets with our latest market updates. Analyze market movers, trends and build your trading strategies accordingly.