-
Opps!
This language contents are not available!

NZD/JPY Price Analysis: Fresh decline heightens downside risk
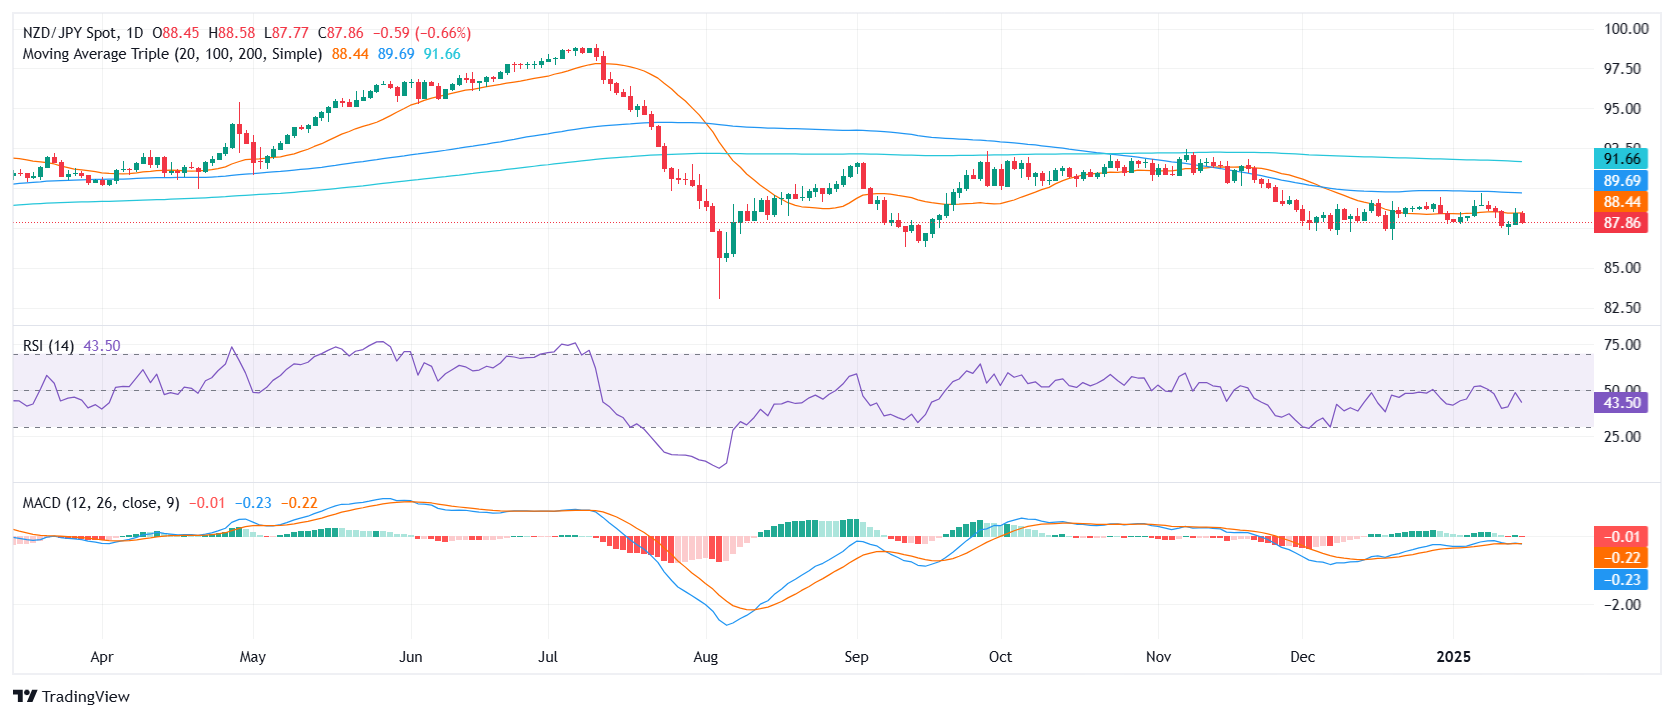
- NZD/JPY landed near 87.80 after the latest rejection at 89.00.
- RSI slides to 44 in negative territory, hinting that selling forces may be gaining ground.
- MACD histogram prints flat red bars, underscoring the pair’s fragile recovery attempts.
The NZD/JPY cross entered deeper negative territory on Wednesday, giving back 0.77% as it settled around 87.80. Sellers took charge following yet another failed effort to conquer the 20-day Simple Moving Average (SMA) near the 89.00 mark. Although the pair had initially shown signs of stabilization within the broader 89.00–87.00 channel, persistent selling pressure has kept it from mounting a convincing rebound.
On the technical front, the Relative Strength Index (RSI) has weakened to 44, reflecting a loss of buying momentum. Similarly, the Moving Average Convergence Divergence (MACD) histogram remains flat and in the red, indicating that the pair’s attempts at recovery lack robust follow-through. This combination of weakening indicators and repeated rejections at 89.00 casts doubt on any near-term upside potential.
As for immediate levels to watch, a drop under 87.50 would place the 87.00 floor under scrutiny, potentially dragging NZD/JPY into deeper territory if selling picks up. In contrast, a clean break above 89.00 remains critical to shifting the short-term bias back toward bullish territory, though buyers seem reluctant to push the market decisively higher at this juncture.
NZD/JPY daily chart

Forex News
Keep up with the financial markets, know what's happening and what is affecting the markets with our latest market updates. Analyze market movers, trends and build your trading strategies accordingly.


