Japanese Yen surrenders modest intraday gains against USD ahead of Trump's inaugural speech
- The Japanese Yen strengthens in reaction to the upbeat Core Machinery Orders data.
- Firming expectations for an additional BoJ rate hike this week also underpin the JPY.
- A modest USD downtick further contributes to the USD/JPY pair's intraday decline.
- A positive risk tone caps the safe-haven JPY ahead of Trump's inaugural address.
The Japanese Yen (JPY) seesaws between minor losses/tepid gains against its American counterpart, with the USD/JPY pair trying to stabilize around the 156.15-156.20 region during the early European session on Monday. An increase in Japan's Core Machinery Orders for the second straight month signaled a further recovery in capital expenditure. This, along with bets that the Bank of Japan (BoJ) will hike interest rates later this week, provided a modest lift to the JPY.
Apart from this, the emergence of fresh US Dollar (USD) selling contributed to the USD/JPY pair's intraday downtick. That said, a generally positive risk tone and uncertainties over the incoming US President Donald Trump's trade policies keep a lid on any meaningful appreciating move for the safe-haven JPY. Traders also seem reluctant ahead of Trump's inaugural address this Monday and the highly-anticipated two-day BoJ policy meeting starting on Thursday.
Japanese Yen traders remain on the sidelines ahead of Trump's inauguration and BoJ this week
- Government data released earlier this Monday showed that Japan's Core Machinery Orders increased by 3.4% month-on-month in November 2024, marking the second consecutive month of increase and the strongest growth in nine months.
- This comes on top of the broadening inflation and strong wage growth in Japan, which, along with hawkish remarks from Bank of Japan officials, lifted bets for another rate hike later this week and offered some support to the Japanese Yen.
- BoJ Deputy Governor Ryozo Himino said last week that a rate hike will be discussed at the January 23-24 meeting as prospects of sustained wage gains heighten and the US policy outlook under President-elect Donald Trump becomes clearer.
- Moreover, BoJ Governor Kazuo Ueda said last week that there was a lot of positive talk on the wage outlook and reiterated that the central bank would raise the policy rate further this year if economic and price conditions continue to improve.
- Adding to this, a BoJ report released earlier this month showed that wage hikes are spreading to firms of all sizes and sectors in Japan, suggesting that conditions for a near-term interest rate hike were continuing to fall into place.
- The JPY bulls, however, might refrain from placing aggressive bets and opt to move to the sidelines ahead of US President-elect Donald Trump's inaugural address later this Monday and a two-day BoJ meeting starting Thursday.
- Data released last week suggested that the underlying inflation in the US slowed last month and fueled speculations that the Federal Reserve may not necessarily exclude the possibility of cutting interest rates further in 2025.
- Furthermore, Fed Governor Christopher Waller said last Thursday that inflation is likely to continue to ease and that as many as three or four quarter-percentage-point rate reductions could still be possible by the end of this year.
- The US Commerce Department's Census Bureau reported on Friday that Housing Starts rose 3.3% in December, to a seasonally adjusted annual rate of 1.50 million units, marking the highest level since February 2024.
- This, to a larger extent, offsets a slight disappointment from the latest report on Building Permits, which registered a sudden drop of 0.7% in December as compared to the 5.2% strong growth registered in the previous month.
- The yield on the benchmark 10-year US government bond rebounded after touching a two-week low on Friday, which assisted the US Dollar to snap a four-day losing streak and offered support to the USD/JPY pair.
USD/JPY manages to defend ascending channel support; bearish potential seems intact
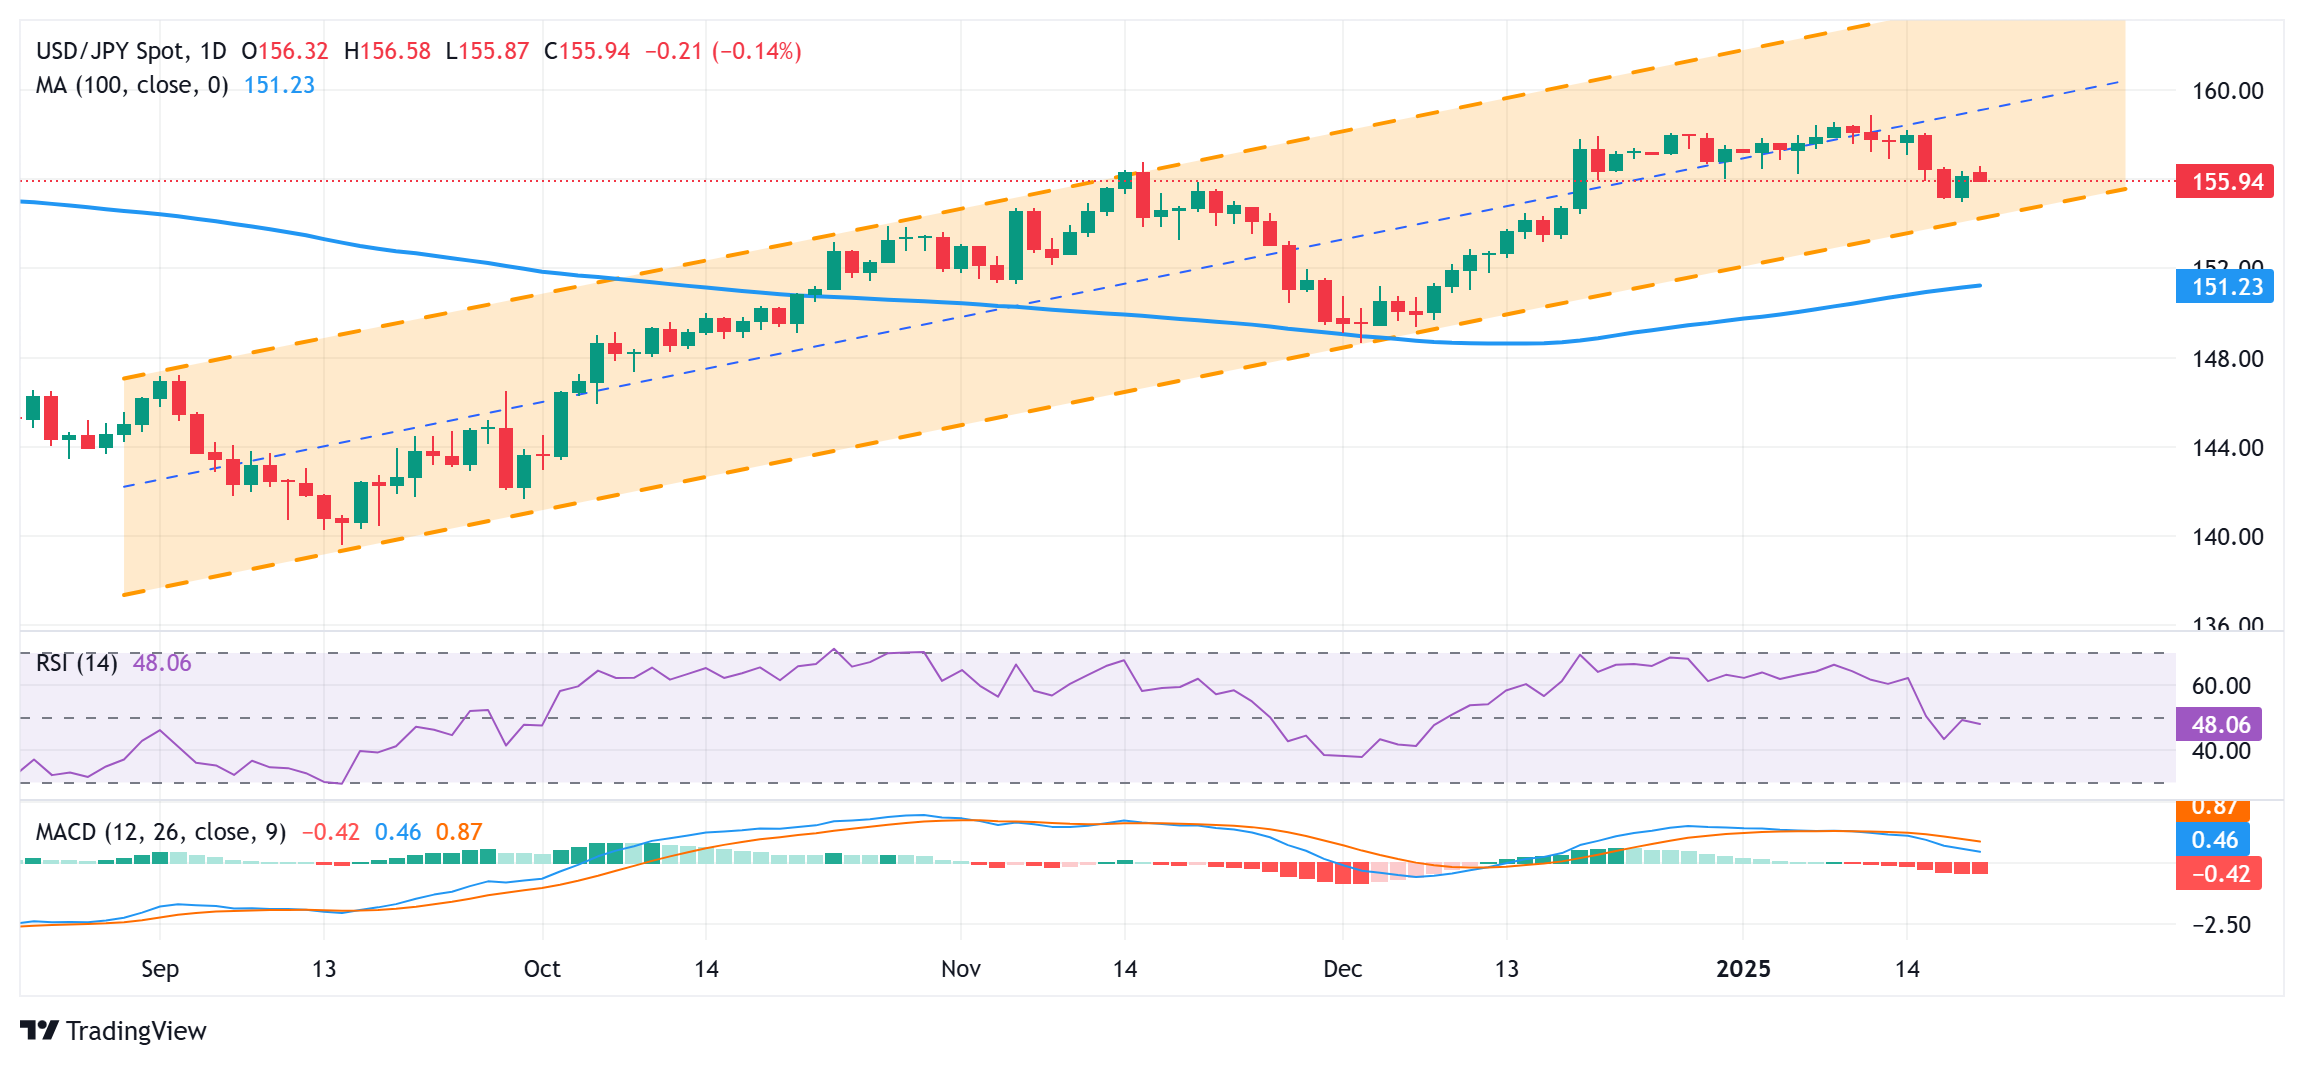
From a technical perspective, Friday's bounce from support marked by the lower boundary of a multi-month-old ascending channel falters near the 156.55-156.60 region. The said area should now act as an immediate hurdle, above which a fresh bout of a short-covering could allow the USD/JPY pair to reclaim the 157.00 round figure. The subsequent move up could extend further towards the 157.40-157.45 intermediate barrier en route to the 158.00 mark and the 158.85 region, or a multi-month top touched on January 10.
On the flip side, the ascending channel support, currently pegged near the 155.25 area, might continue to protect the immediate downside ahead of the 155.00 psychological mark. A sustained break and acceptance below the latter will be seen as a fresh trigger for bearish traders and drag the USD/JPY pair towards the 154.60-154.55 region. Spot prices could extend the downward trajectory further towards the 154.00 mark en route to the next relevant support near the 153.35-153.30 horizontal zone.
US Dollar PRICE Today
The table below shows the percentage change of US Dollar (USD) against listed major currencies today. US Dollar was the strongest against the Japanese Yen.
| USD | EUR | GBP | JPY | CAD | AUD | NZD | CHF | |
|---|---|---|---|---|---|---|---|---|
| USD | -0.37% | -0.36% | 0.00% | -0.17% | -0.37% | -0.32% | -0.03% | |
| EUR | 0.37% | -0.05% | 0.26% | 0.10% | 0.07% | -0.06% | 0.21% | |
| GBP | 0.36% | 0.05% | 0.27% | 0.14% | 0.13% | -0.01% | 0.27% | |
| JPY | 0.00% | -0.26% | -0.27% | -0.15% | -0.31% | -0.41% | -0.19% | |
| CAD | 0.17% | -0.10% | -0.14% | 0.15% | -0.14% | -0.15% | 0.12% | |
| AUD | 0.37% | -0.07% | -0.13% | 0.31% | 0.14% | -0.22% | 0.10% | |
| NZD | 0.32% | 0.06% | 0.01% | 0.41% | 0.15% | 0.22% | 0.09% | |
| CHF | 0.03% | -0.21% | -0.27% | 0.19% | -0.12% | -0.10% | -0.09% |
The heat map shows percentage changes of major currencies against each other. The base currency is picked from the left column, while the quote currency is picked from the top row. For example, if you pick the US Dollar from the left column and move along the horizontal line to the Japanese Yen, the percentage change displayed in the box will represent USD (base)/JPY (quote).
Forex News
Keep up with the financial markets, know what's happening and what is affecting the markets with our latest market updates. Analyze market movers, trends and build your trading strategies accordingly.
