Silver Price Analysis: XAG/USD climbs to one-month high around $24.40, 50% Fibo. level
- Silver scales higher for the second straight day and climbs to a near one-month high.
- The overnight breakout through the $24.00 mark supports prospects for further gains.
- A sustained weakness below the $23.60-55 area is needed to negate the positive outlook.
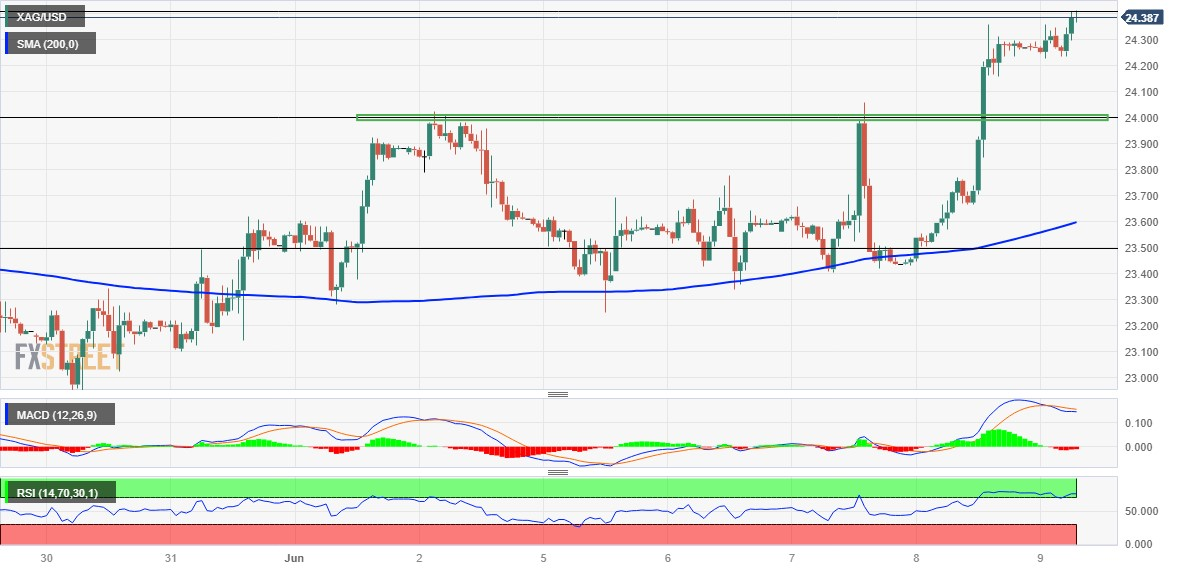
Silver builds on the previous day's strong rally and gains some follow-through traction for the second successive day on Friday. The buying interest picks up pace during the early European session and lifts the white metal to a nearly one-month top, around the $24.40 region in the last hour.
Against the backdrop of the recent repeated failures to find acceptance below the 200-hour Simple Moving Average (SMA), the overnight sustained strength beyond the $24.00 mark was seen as a fresh trigger for bullish traders. The said handle coincides with the 38.2% Fibonacci retracement level of the downfall witnessed in May, from over a one-year peak, and should now act as a pivotal point for short-term traders.
Meanwhile, technical indicators on the daily chart have just started gaining positive traction and support prospects for a further near-term appreciating move. That said, Relative Strength Index (RSI) is flashing slightly overbought conditions on hourly charts and warrants some caution for bulls. This makes it prudent to wait for some intraday consolidation near the $24.45-$24.50 area, or the 50% Fibo. level before placing fresh bets.
Nevertheless, the XAG/USD now seems poised to surpass an intermediate hurdle near the $24.25-$24.30 region and aim to reclaim the $25.00 psychological mark. Some follow-through buying should pave the way for a further near-term appreciating move towards the next relevant hurdle is pegged near the $24.35-$24.40 region, above which the XAG/USD is likely to make a fresh attempt towards conquering the $26.00 mark.
On the flip side, the 38.2% Fibo. level, around the $24.00 round figure, now seems to protect the immediate downside. Any subsequent fall could be seen as a buying opportunity and remain limited near the $23.60-$23.55 confluence, comprising of the 200-period SMA on the 4-hour chart and the 23.6% Fibo. level. The said area should act as a strong base for the XAG/USD, which if broken will negate the positive outlook.
Silver 1-hour chart
Key levels to watch
Forex News
Keep up with the financial markets, know what's happening and what is affecting the markets with our latest market updates. Analyze market movers, trends and build your trading strategies accordingly.