EUR/USD edges lower as ECB supports gradual policy-easing approach
- EUR/USD ticks lower slightly below 1.0300 as the US Dollar rises despite traders re-evaluating the Fed’s likely interest rate outlook for the entire year.
- Traders see at least one interest rate cut this year after mixed US inflation data for December.
- ECB’s Villeroy sees the deposit facility rate sliding to 2% by the mid-year.
EUR/USD falls on Thursday as the broader outlook of the Euro (EUR) has weakened after the release of European Central Bank (ECB) Accounts, which showed that all officials agreed to a gradual interest rate cut approach amid confidence that inflation will return to target in the first half of 2025. The minutes of the ECB account for the meeting on December 11-12 showed, "If the baseline projection for inflation was confirmed over the next few months and quarters, a gradual dialing-back of policy restrictiveness was seen as appropriate."
According to a January 10-15 period Reuters poll, all 77 economists see the ECB reducing the Deposit Facility rate by 25 basis points (bps) to 2.75% in the January meeting, and 60% of them are confident about three additional 25 bps interest rate cuts by the mid-year.
Meanwhile, ECB officials are also comfortable with expectations that the Deposit Rate will slide to 2% by mid-summer. ECB policymaker and Governor of the Bank of France François Villeroy de Galhau said, "It makes sense for interest rates to reach 2% by the summer," as we have practically won the "battle against inflation." Villeroy added that bringing down borrowing costs will bolster the “financing of the economy” and a “drop in the household savings rate.”
The outlook of the Eurozone economy remains vulnerable as market participants worry that higher import tariffs by the US under Trump’s administration will weigh on the export sector significantly.
Euro PRICE Today
The table below shows the percentage change of Euro (EUR) against listed major currencies today. The Euro was the strongest against the New Zealand Dollar.
| USD | EUR | GBP | JPY | CAD | AUD | NZD | CHF | |
|---|---|---|---|---|---|---|---|---|
| USD | 0.20% | 0.43% | -0.28% | 0.37% | 0.36% | 0.45% | 0.02% | |
| EUR | -0.20% | 0.23% | -0.46% | 0.17% | 0.16% | 0.26% | -0.18% | |
| GBP | -0.43% | -0.23% | -0.70% | -0.06% | -0.07% | 0.02% | -0.41% | |
| JPY | 0.28% | 0.46% | 0.70% | 0.63% | 0.63% | 0.67% | 0.29% | |
| CAD | -0.37% | -0.17% | 0.06% | -0.63% | -0.00% | 0.08% | -0.35% | |
| AUD | -0.36% | -0.16% | 0.07% | -0.63% | 0.00% | 0.09% | -0.34% | |
| NZD | -0.45% | -0.26% | -0.02% | -0.67% | -0.08% | -0.09% | -0.43% | |
| CHF | -0.02% | 0.18% | 0.41% | -0.29% | 0.35% | 0.34% | 0.43% |
The heat map shows percentage changes of major currencies against each other. The base currency is picked from the left column, while the quote currency is picked from the top row. For example, if you pick the Euro from the left column and move along the horizontal line to the US Dollar, the percentage change displayed in the box will represent EUR (base)/USD (quote).
Daily digest market movers: EUR/USD drops despite higher US Jobless Claims, moderate Retail Sales growth
- EUR/USD drops below 1.0300 in Thursday’s North American session. The major currency pair declines as the US Dollar (USD) gains ground, with the US Dollar Index (DXY) rising to near 109.25. The USD Index recovers a majority of Wednesday’s losses that were driven by mixed United States (US) Consumer Price Index (CPI) data for December.
- The US CPI report showed that price pressures were broadly mixed. On a yearly basis, headline inflation accelerated expectedly, while the core reading rose at a slower-than-projected pace. Signs of mixed inflationary pressures forced traders to reassess market expectations for the Federal Reserve’s (Fed) monetary policy outlook.
- According to the CME FedWatch tool, traders anticipate more than one interest rate cut this year, similar to what officials projected in December’s Summary of Economic Projections (SEP). Before Wednesday’s inflation data, traders expected the Fed to cut interest rates only once this year.
- However, Fed officials are still worried about the inflation outlook amid uncertainty over incoming policies under President-elect Donald Trump’s administration. New York Fed Bank President John Williams said in a speech at the CBIA Economic Summit on Wednesday that the disinflation process is “in train”; however, the economic outlook remains highly uncertain, especially around “potential fiscal, trade, immigration, and regulatory policies.”
- Meanwhile, the US Initial Jobless Claims data for the week ending January 10 has come in higher than projected. Individuals claiming jobless benefits for the first time came in higher at 217K than estimates of 210K and the former release of 203K. The US Retail Sales data for December grew moderately by 0.4%, compared to estimates of 0.6% and November's reading of 0.8%.
Technical Analysis: EUR/USD holds recovery to near 1.0300

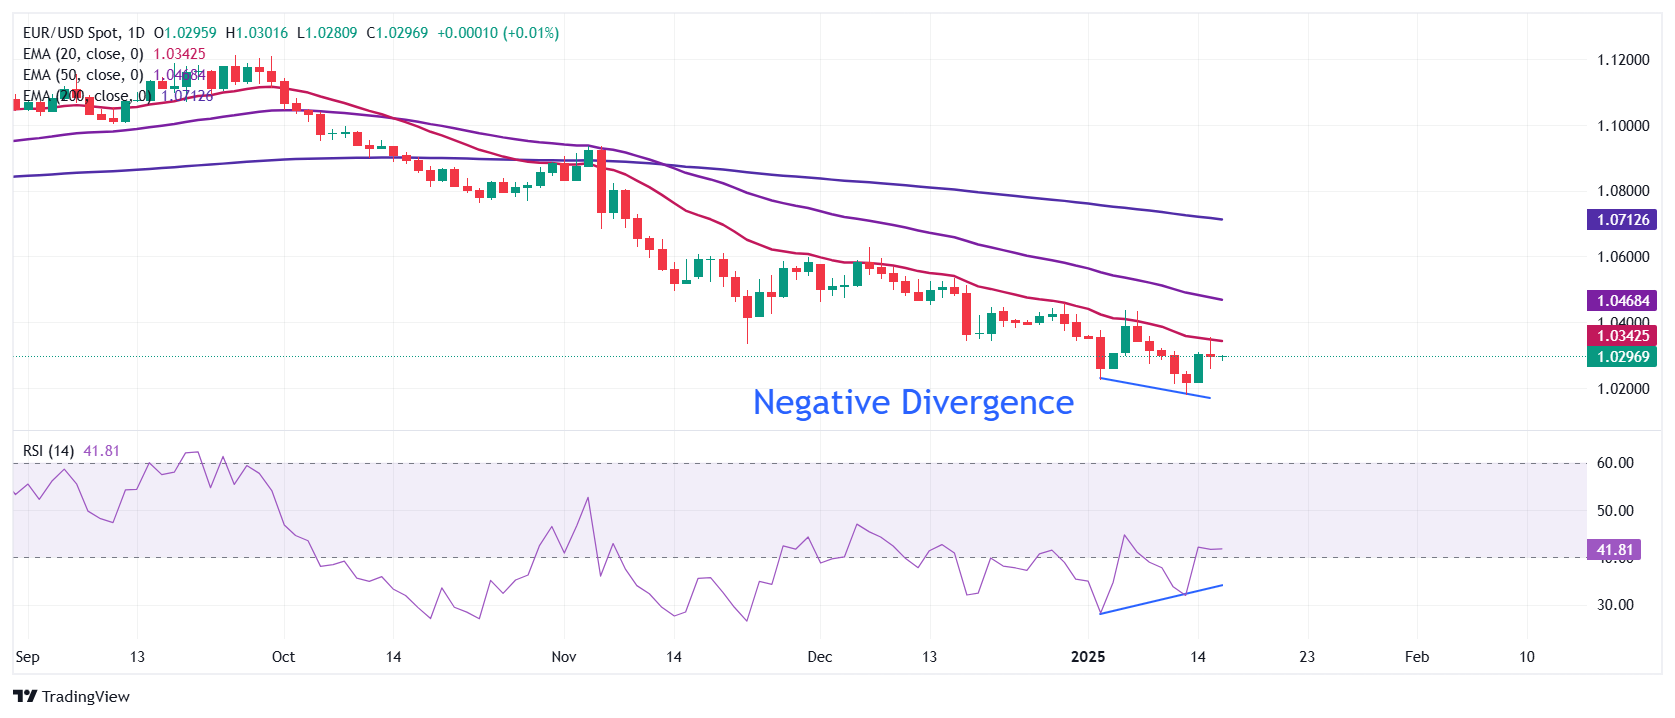
EUR/USD holds rebound to near 1.0300 after gaining ground from the over-two-year low of 1.0175 reached on Monday. The major currency pair bounces back on divergence in momentum and price action. The 14-day Relative Strength Index (RSI) formed a higher low near 35.00, while the pair made lower lows.
However, the outlook of the shared currency pair is still bearish as all short-to-long-term Exponential Moving Averages (EMAs) are sloping downwards.
Looking down, Monday’s low of 1.0175 will be the key support zone for the pair. Conversely, the January 6 high of 1.0437 will be the key barrier for the Euro bulls.
Forex News
Keep up with the financial markets, know what's happening and what is affecting the markets with our latest market updates. Analyze market movers, trends and build your trading strategies accordingly.
