USD/MXN Price Analysis: Trades with mild negative bias, dip-buying should help limit deeper losses
- USD/MXN remains depressed for the third successive day on Monday.
- The mixed technical setup warrants some caution for bearish traders.
- Any further decline towards the 17.2500 support could get bought into.
The USD/MXN pair attracts some sellers near the 17.4420 area during the Asian session and trades with a mild negative bias for the third successive day on Monday. Spot prices, however, manage to hold above a multi-day touched on Friday and currently hover around the 17.4000 level, down just over 0.10% for the day.
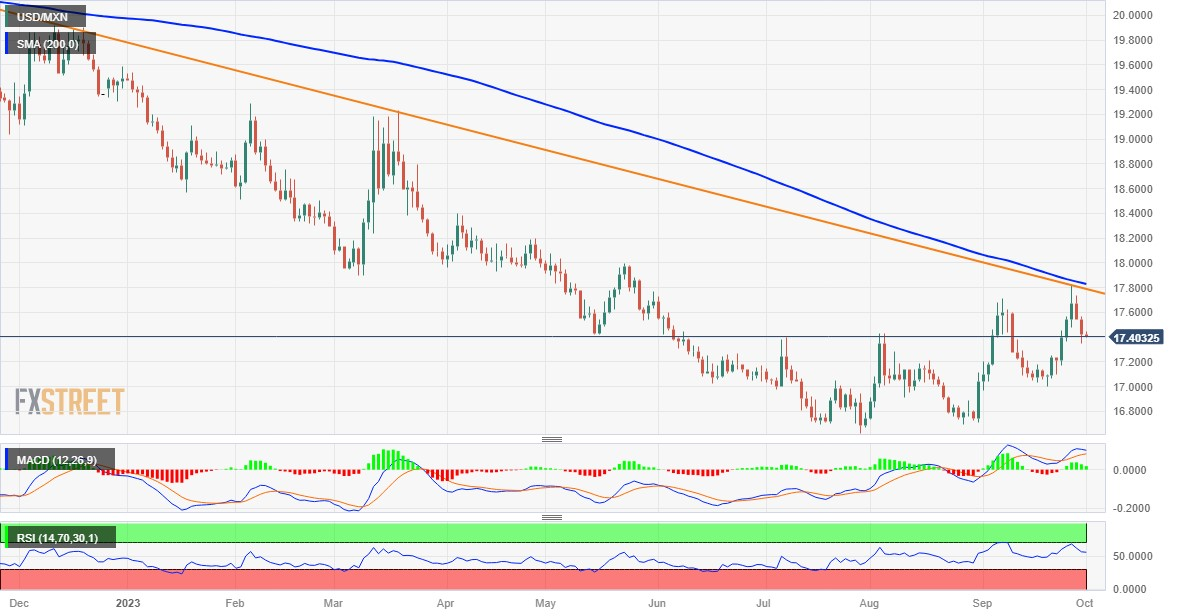
From a technical perspective, last week's failure near the 17.8175 confluence – comprising a declining trendline extending from the July swing high and the very important 200-day Simple Moving Average (SMA) – and the subsequent slide favours bearish traders. That said, oscillators on the daily chart are holding in the positive territory and warrant some caution before positioning for any further losses for the USD/MXN pair.
Hence, any further decline is more likely to find decent support near the 17.2510-17.2500 horizontal zone. The mentioned area should act as a pivotal point, which if broken decisively will reaffirm the negative outlook and drag the USD/MXN pair to the next relevant support near the 17.0400 area en route to sub-17.0000 levels (September 20 low). The downward trajectory could get extended further towards the 16.7550 support.
On the flip side, the 17.5415-17.5420 region now seems to act as an immediate hurdle ahead of the 17.6695-17.7000 area. Some follow-through buying should allow the USD/MXN to challenge the aforementioned confluence, around the 17.8100-17.8175 zone. A convincing breakout through will be seen as a fresh trigger for bullish traders and pave the way for an extension of the recent recovery from a multi-year low touched in August.
USD/MXN daily chart

Technical levels to watch
Forex News
Keep up with the financial markets, know what's happening and what is affecting the markets with our latest market updates. Analyze market movers, trends and build your trading strategies accordingly.
