
Japanese Yen remains on the back foot against USD; lacks follow-through ahead of US NFP
- The Japanese Yen retreats after touching a two-month high against the USD on Friday.
- The narrowing US-Japan rate differential should limit losses for the lower-yielding JPY.
- Subdued USD price action might cap the USD/JPY pair ahead of the US NFP report.
The Japanese Yen (JPY) sticks to its modest intraday losses against its American counterpart through the early European session on Friday in the wake of cautious remarks from the International Monetary Fund (IMF). The downside for the JPY, however, remains cushioned in the wake of the growing acceptance that the Bank of Japan (BoJ) would keep tightening its policy.
In fact, comments from a senior BoJ official on Thursday suggested the Japanese central bank is maintaining its stance to steadily push up borrowing costs. This will result in the narrowing of the rate differential between the BoJ and other major central banks, including the Federal Reserve (Fed), which continues to act as a tailwind and limits losses for the lower-yielding JPY.
Apart from this, subdued US Dollar (USD) price action fails to assist the USD/JPY pair to capitalize on its intraday bounce from sub-151.00 levels or the lowest level since December 10 touched earlier today. Traders also seem reluctant to place aggressive bets and opt to wait for the release of the US jobs data – popularly known as the Nonfarm Payrolls (NFP) report.
Japanese Yen bears seem non-committed amid the divergent BoJ-Fed outlook
- The International Monetary Fund said on Friday that Japan should be on alert for any spillover effects from rising volatility in foreign markets that could affect liquidity conditions for its financial institutions.
- The IMF also warned Japan needs to be vigilant about monitoring any fallout from the Bank of Japan's rate hikes, such as an increase in the government's debt-servicing costs and a possible jump in corporate bankruptcies.
- Kazuhiro Masaki, Director General of the BoJ's monetary affairs department, said on Thursday that the central bank will continue to raise interest rates if underlying inflation accelerates toward its 2% target as projected.
- Japan's Economy Minister Ryosei Akazawa told the parliament that the government's focus would be to eradicate a deflationary mindset with a goal to boost minimum wages and take measures to encourage firms to raise wages.
- This comes on top of the hawkish BoJ Summary of Opinions released on Monday, which showed that policymakers discussed the likelihood of raising interest rates further at the January meeting and continued to boost the Japanese Yen.
- Adding to this, data released this week showed that Japan’s inflation-adjusted real wages rose 0.6% year-on-year in December, marking the second consecutive monthly gain and backing the case for further tightening by the BoJ.
- The yield on Japan’s 10-year government bond remains near a 14-year high, while the benchmark 10-year US Treasury yield hangs near its lowest level since December amid expectations that the Federal Reserve would stick to its easing bias.
- US Treasury Secretary Scott Bessent said on Thursday that President Donald Trump's administration was not particularly concerned about the Fed's trajectory on interest rates and that the focus is on bringing down 10-year Treasury yields.
- Chicago Fed President Austan Goolsbee noted that the appearance that inflation has stalled is largely due to base effects and that the central bank needs to be mindful of overheating and deterioration, but things are largely going well.
- Separately, Dallas Fed President Lorie Logan said that inflation progress has been significant, but the US labor market remains far too firm to push the central bank into rate cuts any time soon. This, however, does little to impress the US Dollar bulls.
- That said, traders opt to lighten their bets and move to the sidelines ahead of the release of the US Nonfarm Payrolls (NFP) report, prompting an aggressive intraday short-covering move around the USD/JPY pair on Friday.
USD/JPY remains vulnerable while below the 152.50 confluence breakpoint
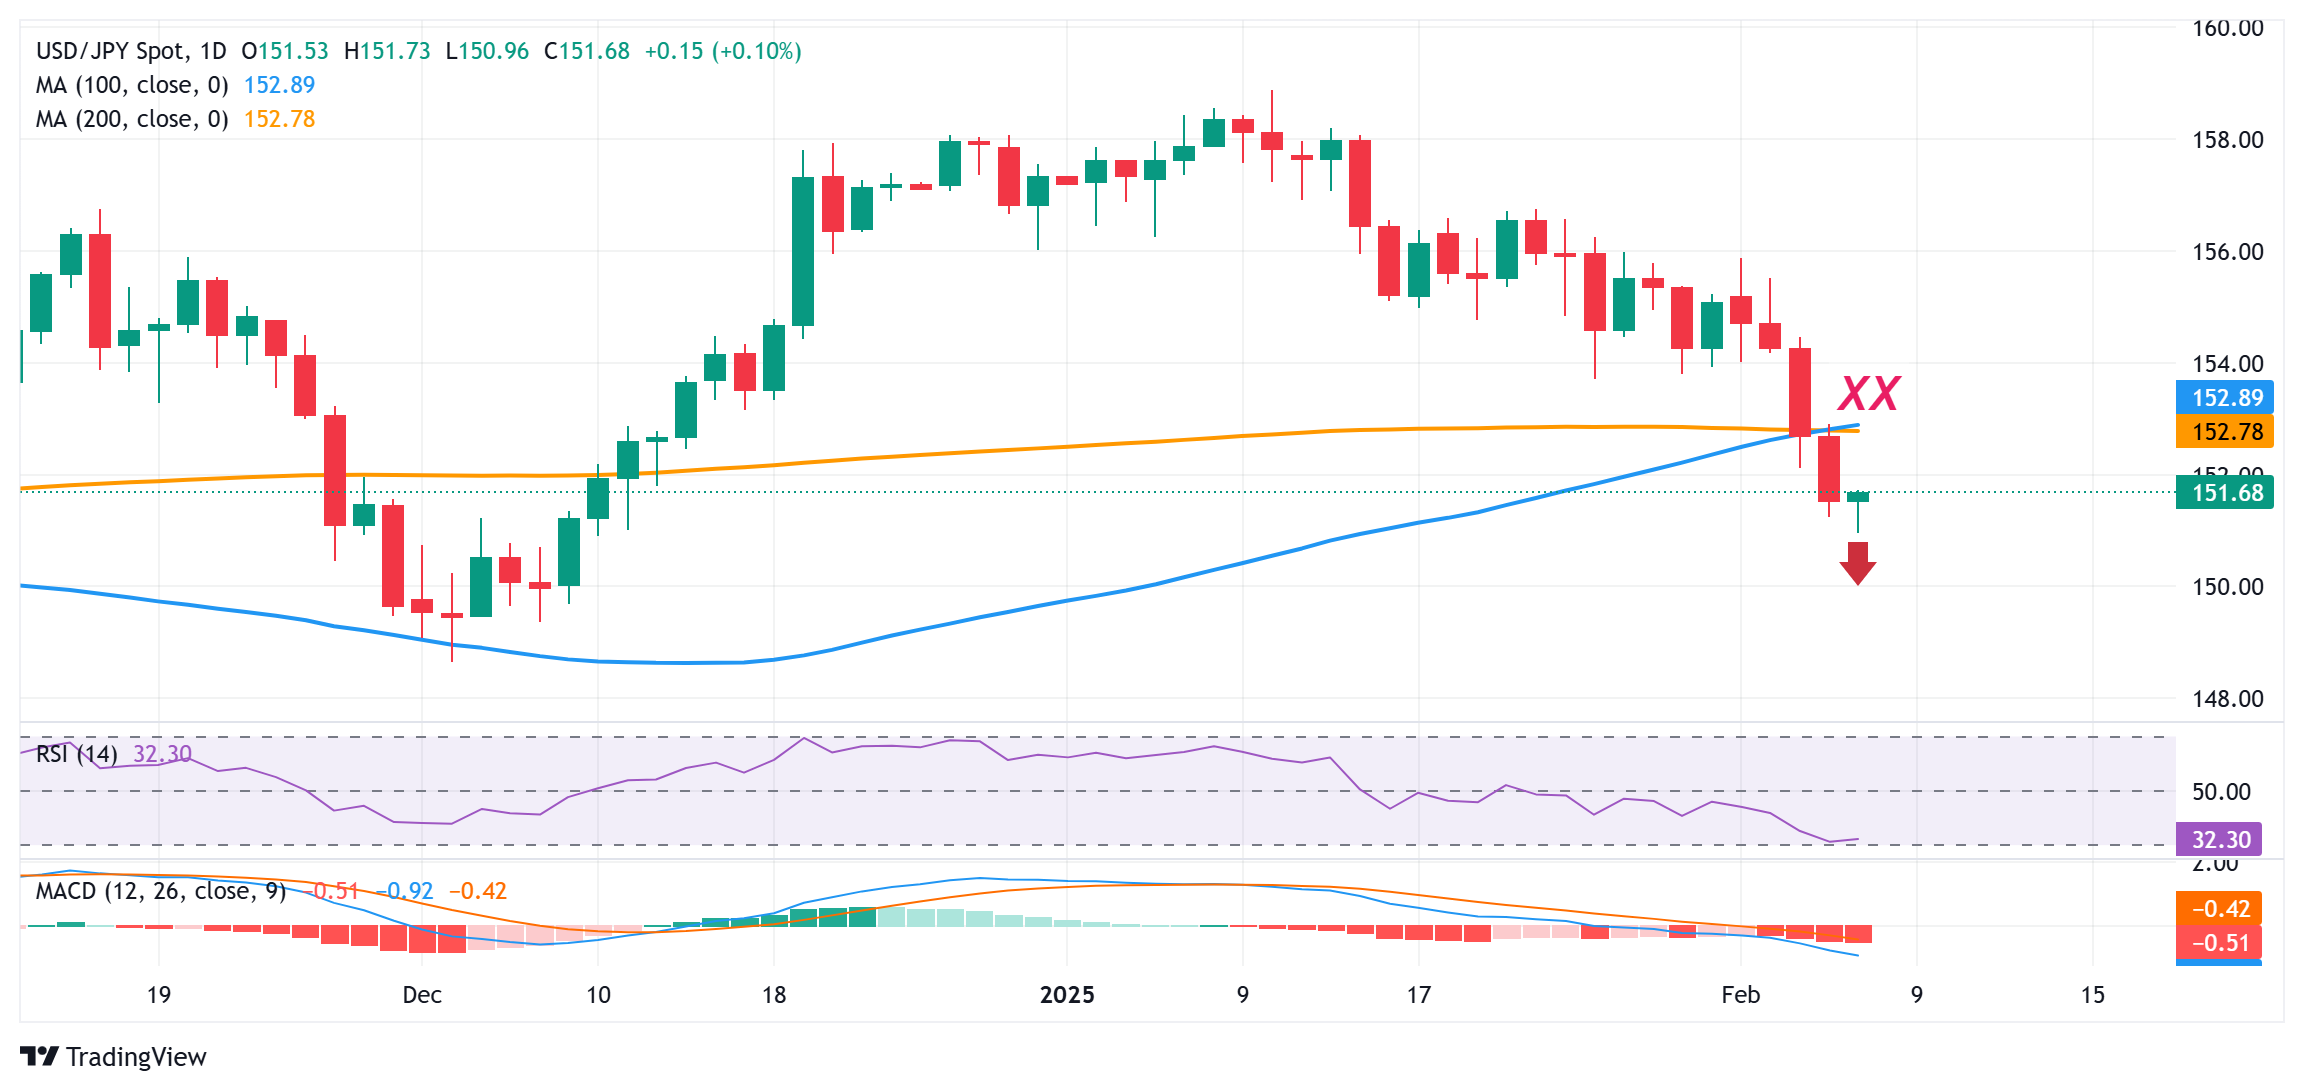
From a technical perspective, this week's breakdown below the 152.50-152.45 confluence – comprising the 100- and the 200-day Simple Moving Averages (SMAs) was seen as a key trigger for bearish traders. Moreover, oscillators on the daily chart are holding deep in negative territory and are still away from being in the oversold zone. This, in turn, suggests that the path of least resistance for the USD/JPY pair remains to the downside. Hence, any subsequent move up could be seen as a selling opportunity and remain capped near the 152.00 mark. Some follow-through buying, however, could lift spot prices further toward the next relevant hurdle near the 152.50-152.45 support-turned-resistance en route to the 153.00 round figure.
On the flip side, the 151.00 mark now seems to have emerged as an immediate support. A sustained break and acceptance below the said handle could drag the USD/JPY pair further towards 150.55-150.50 support. The downward trajectory could extend further towards the 150.00 psychological mark, below which spot prices could slide to the 149.60 horizontal support before aiming to test the 149.00 mark and the December swing low, around the 148.65 region.
Economic Indicator
Nonfarm Payrolls
The Nonfarm Payrolls release presents the number of new jobs created in the US during the previous month in all non-agricultural businesses; it is released by the US Bureau of Labor Statistics (BLS). The monthly changes in payrolls can be extremely volatile. The number is also subject to strong reviews, which can also trigger volatility in the Forex board. Generally speaking, a high reading is seen as bullish for the US Dollar (USD), while a low reading is seen as bearish, although previous months' reviews and the Unemployment Rate are as relevant as the headline figure. The market's reaction, therefore, depends on how the market assesses all the data contained in the BLS report as a whole.
Read more.Next release: Fri Feb 07, 2025 13:30
Frequency: Monthly
Consensus: 170K
Previous: 256K
Source: US Bureau of Labor Statistics
America’s monthly jobs report is considered the most important economic indicator for forex traders. Released on the first Friday following the reported month, the change in the number of positions is closely correlated with the overall performance of the economy and is monitored by policymakers. Full employment is one of the Federal Reserve’s mandates and it considers developments in the labor market when setting its policies, thus impacting currencies. Despite several leading indicators shaping estimates, Nonfarm Payrolls tend to surprise markets and trigger substantial volatility. Actual figures beating the consensus tend to be USD bullish.
Forex News
Keep up with the financial markets, know what's happening and what is affecting the markets with our latest market updates. Analyze market movers, trends and build your trading strategies accordingly.