
Australian Dollar defends position due to hawkish sentiment surrounding the RBA
- The Australian Dollar rises as the solid employment data diminish the odds of RBA’s rate cuts in 2024.
- China’s Gross Domestic Product reported a 4.6% growth YoY in Q3, compared to the previous 4.7% reading.
- The US Dollar received support from a solid US Retail Sales report, fueling the likelihood of the Fed delivering nominal rate cuts.
The Australian Dollar (AUD) continued to strengthen against the US Dollar (USD) for the second consecutive day on Friday. This upside of the AUD/USD pair is largely due to stronger-than-expected domestic employment data released on Thursday, which led traders to scale back expectations of a Reserve Bank of Australia (RBA) interest rate cut this year.
The Australian Dollar may have also gained support from confirmation of rate cuts in China, its largest trading partner. China's Industrial Commercial Bank, Bank of Communications, and China Merchants Bank announced a 25 basis point cut. Lower interest rates are expected to stimulate domestic economic activity, which in turn could boost demand for Australian exports to China.
China’s Gross Domestic Product (GDP) grew at an annual rate of 4.6% in the third quarter of 2024, slightly down from the 4.7% growth recorded in the second quarter but exceeding market expectations of 4.5%. On a quarterly basis, GDP rose by 0.9% in Q3 2024, up from 0.7% in the previous quarter but falling short of the 1.0% forecast. China’s Retail Sales in September increased by 3.2% year-over-year, outperforming both the expected 2.5% growth and the prior figure of 2.1%.
The US Dollar (USD) edges lower as Treasury yields decline. However, the Greenback reached a two-month high of 103.87 on Thursday, supported by a solid US Retail Sales report, which fueled expectations that the Federal Reserve (Fed) may implement nominal rate cuts. According to the CME FedWatch Tool, there is a 90.8% probability of a 25-basis-point rate cut in November and a 74.0% chance of another cut in December.
Daily Digest Market Movers: Australian Dollar rises as solid labor data diminishes RBA rate cuts
- On Friday, People's Bank of China (PBOC) Governor Pan Gongsheng stated that the Chinese central bank has "issued specific guidelines for stock buybacks and reloans to boost holdings, emphasizing that credit funds must not illegally flow into the stock market."
- National Australia Bank revised its projection for the Reserve Bank of Australia (RBA) in a note this week. "We have brought forward our expectations for the timing of rate cuts, now anticipating the first cut in February 2025, instead of May," the bank stated. They continue to foresee a gradual pace of cuts, with rates expected to decrease to 3.10% by early 2026.
- US Retail Sales rose by 0.4% month-over-month in September, surpassing both the 0.1% gain recorded in August and market expectations of a 0.3% increase. Additionally, US Initial Jobless Claims fell by 19,000 during the week ending October 11, the largest decline in three months. The total number of claims dropped to 241,000, significantly below the anticipated 260,000.
- The seasonally adjusted Employment Change in Australia surged by 64.1K in September, bringing the total employment to a record 14.52 million. This far surpassed market expectations of a 25.0K increase, following a revised rise of 42.6K in the previous month. Meanwhile, the Unemployment Rate remained steady at 4.1% in September, matching the revised figure for August and coming in lower than the anticipated 4.2%.
- On Wednesday, Reserve Bank of Australia (RBA) Deputy Governor Sarah Hunter reiterated the central bank's commitment to curbing inflation, emphasizing that although inflation expectations remain well-anchored, ongoing price pressures continue to present significant challenges.
- On Tuesday, Federal Reserve Bank of Atlanta President Raphael Bostic stated that he anticipates just one more interest rate cut of 25 basis points this year, as reflected in his projections during last month's US central bank meeting. "The median forecast was for 50 basis points beyond the 50 basis points already implemented in September. My projection was for an additional 25 basis points," he said, according to Reuters.
- Federal Reserve (Fed) Bank of Minneapolis President Neel Kashkari reassured markets late on Monday by reaffirming the Fed's data-dependent approach. Kashkari reiterated familiar Fed policymaker views on the strength of the US economy, noting continued easing of inflationary pressures and a robust labor market, despite a recent uptick in the overall unemployment rate, per Reuters.
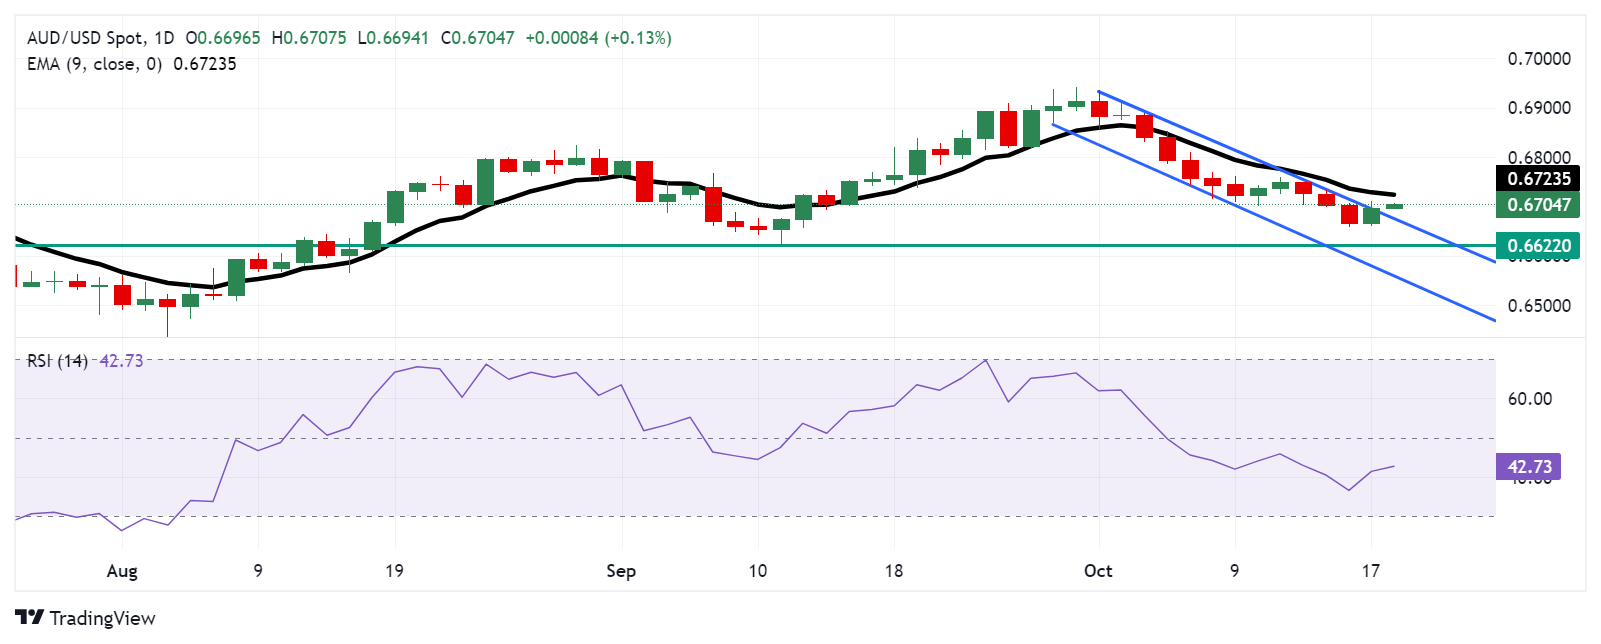
Technical Analysis: Australian Dollar breaks above 0.6700, descending channel
The AUD/USD pair trades around 0.6710 on Friday. A technical analysis of the daily chart shows that the pair has successfully broken above the descending channel pattern, indicating a potential shift from a bearish to a bullish trend. However, the 14-day Relative Strength Index (RSI) remains below 50, suggesting that bearish sentiment is still prevalent.
On the upside, the AUD/USD pair could test the nine-day Exponential Moving Average (EMA) at 0.6724, followed by a key psychological resistance at 0.6800.
Regarding support, the pair may attempt to re-enter the descending channel. A successful return could reinforce the bearish outlook, with the pair potentially targeting its eight-week low of 0.6622, last seen on September 11, and then the lower boundary of the descending channel around 0.6580.
AUD/USD: Daily Chart
Australian Dollar PRICE Today
The table below shows the percentage change of Australian Dollar (AUD) against listed major currencies today. Australian Dollar was the strongest against the US Dollar.
| USD | EUR | GBP | JPY | CAD | AUD | NZD | CHF | |
|---|---|---|---|---|---|---|---|---|
| USD | -0.07% | -0.09% | -0.16% | 0.00% | -0.12% | -0.03% | 0.00% | |
| EUR | 0.07% | 0.00% | -0.07% | 0.06% | -0.07% | 0.06% | 0.09% | |
| GBP | 0.09% | -0.00% | -0.06% | 0.07% | -0.05% | 0.07% | 0.05% | |
| JPY | 0.16% | 0.07% | 0.06% | 0.15% | 0.03% | 0.11% | 0.13% | |
| CAD | -0.00% | -0.06% | -0.07% | -0.15% | -0.12% | -0.00% | -0.03% | |
| AUD | 0.12% | 0.07% | 0.05% | -0.03% | 0.12% | 0.10% | 0.10% | |
| NZD | 0.03% | -0.06% | -0.07% | -0.11% | 0.00% | -0.10% | -0.00% | |
| CHF | -0.00% | -0.09% | -0.05% | -0.13% | 0.03% | -0.10% | 0.00% |
The heat map shows percentage changes of major currencies against each other. The base currency is picked from the left column, while the quote currency is picked from the top row. For example, if you pick the Australian Dollar from the left column and move along the horizontal line to the US Dollar, the percentage change displayed in the box will represent AUD (base)/USD (quote).
Forex News
Keep up with the financial markets, know what's happening and what is affecting the markets with our latest market updates. Analyze market movers, trends and build your trading strategies accordingly.