US Dollar turns red on Friday ahead of Trump's inauguration
- The US Dollar is easing in the last trading session before Trump's inauguration.
- Markets are clueless on what to do next after Fed’s Waller comments a March rate cut is still in the cards.
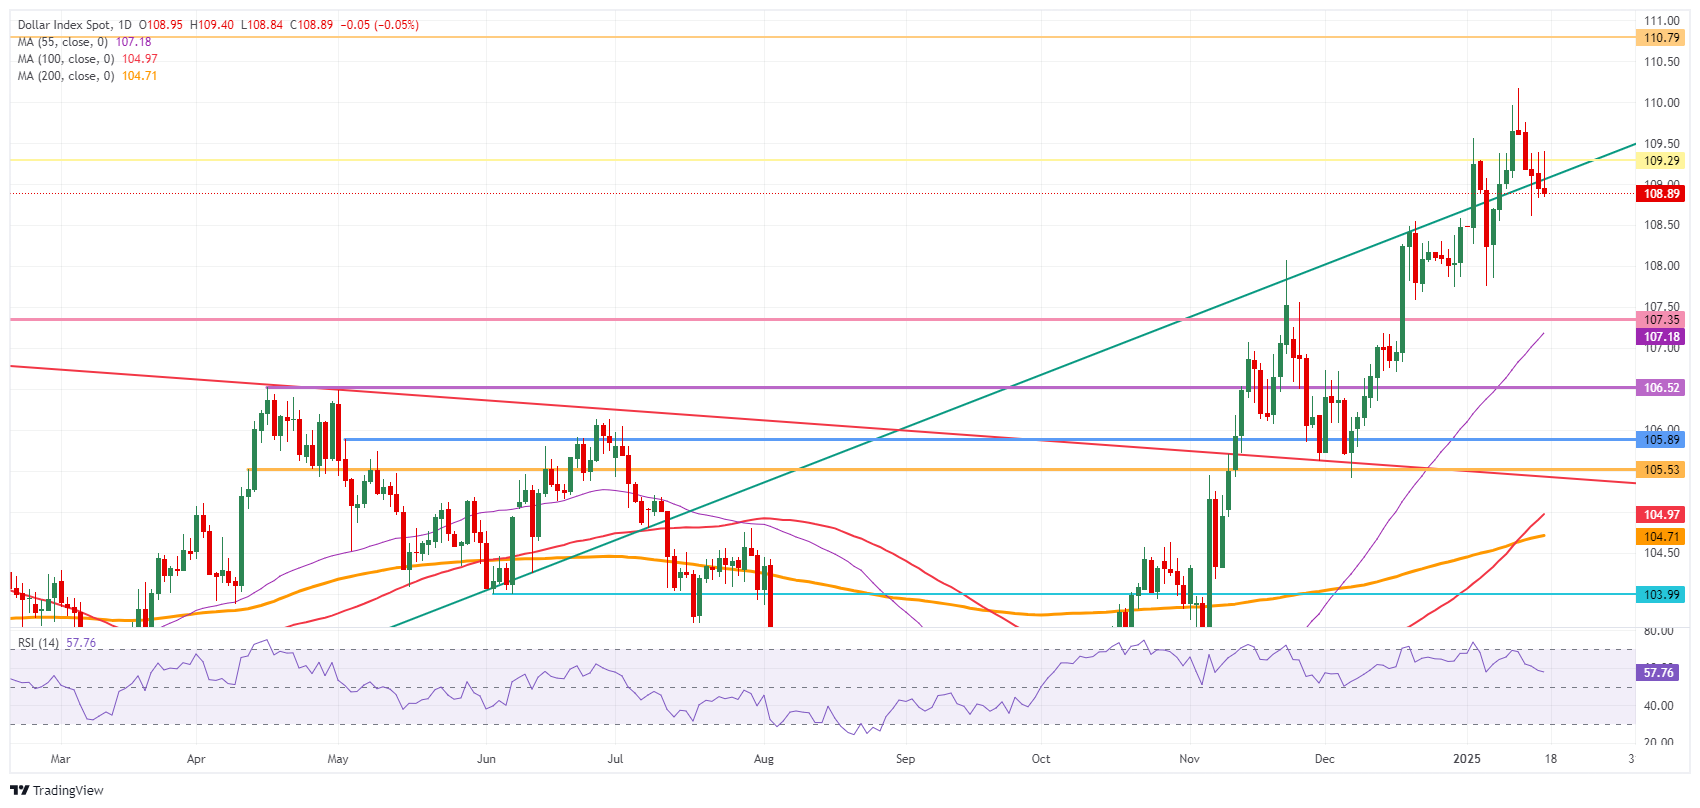
- The US Dollar Index (DXY) moves below 109.00 and is looking for further direction.
The US Dollar Index (DXY), which tracks the Greenback’s value against six major currencies, faces selling pressure and drops below 109.00 on Friday, with positioning is being torn into two camps. After a pivotal move earlier this week on the back of the US Consumer Price Index (CPI) for December, Federal Reserve (Fed) Governor Christopher Waller added some more oil to the fire on Thursday, alluding that a March rate cut would still be appropriate. Traders are now left clueless ahead of President-elect Donald Trump’s inauguration on Monday.
The US economic calendar is very slim this Friday, with some housing data for December on the agenda. Expect traders to consolidate their positions ahead of Monday, when US stock markets will be closed in observance of Martin Luther King Day.
Daily digest market movers: Softening in final hours
- Traders are torn on Friday by comments from Federal Reserve Governor Christopher Waller, who advocated for a Fed rate cut in March on Thursday.
- Meanwhile, the Trump administration has confirmed a battery of executive orders that will be issued once President-elect Donald Trump takes office as the 47th President of the United States on Monday. Those orders include a whole batch of fiscal measures, tariff levies, and stimulus packages, which are bound to have an inflationary impact.
- At 13:30 GMT, US Building Permits and Housing Starts for December have been released. Permits came in at 1.483 million, beating the 1.460 million consensus and below the 1.493 million from the previous month, while Housing Starts soared to 1.499 million, coming from 1.289 million units in November.
- US Industrial Production data came in at 0.9%, beating the 0.3% forecast for December, compared to the slight contraction of 0.1% in the previous month.
- Equities are rallying with the European market closing up for this week. US equities are soaring over 1% on the day.
- The CME FedWatch Tool projects a 97.3% chance that interest rates will be kept unchanged at current levels in the January meeting. Expectations are for the Federal Reserve (Fed) to remain data-dependent with uncertainties that could influence the inflation path once President-elect Donald Trump takes office on Monday.
- The US 10-year yield is trading around 4.596%, down near 4.5% from its Tuesday’s peak of 4.807%.
US Dollar Index Technical Analysis: Dipping in final hours
The US Dollar Index (DXY) is taking it on the chin, and Federal Reserve Governor Christopher Waller delivered the possible knockout blow on the Greenback for now. Waller's bold call for a March rate cut surprised traders and was not priced into market expectations. A wrong-footed market could result now, as the Fed was supposed to remain data-dependent. This could set up markets for an erroneous positioning once President-elect Donald Trump starts to roll out his policy.
On the upside, the 110.00 psychological level remains the key resistance to beat. Further up, the next big upside level to hit before advancing any further remains at 110.79. Once beyond there, it is quite a stretch to 113.91, the double top from October 2022.
On the downside, the DXY is testing the ascending trend line from December 2023, which currently comes in around 108.95 as nearby support. In case of more downside, the next support is 107.35. Further down, the next level that might halt any selling pressure is 106.52, with interim support at the 55-day Simple Moving Average (SMA) at 107.19.
US Dollar Index: Daily Chart
Risk sentiment FAQs
In the world of financial jargon the two widely used terms “risk-on” and “risk off'' refer to the level of risk that investors are willing to stomach during the period referenced. In a “risk-on” market, investors are optimistic about the future and more willing to buy risky assets. In a “risk-off” market investors start to ‘play it safe’ because they are worried about the future, and therefore buy less risky assets that are more certain of bringing a return, even if it is relatively modest.
Typically, during periods of “risk-on”, stock markets will rise, most commodities – except Gold – will also gain in value, since they benefit from a positive growth outlook. The currencies of nations that are heavy commodity exporters strengthen because of increased demand, and Cryptocurrencies rise. In a “risk-off” market, Bonds go up – especially major government Bonds – Gold shines, and safe-haven currencies such as the Japanese Yen, Swiss Franc and US Dollar all benefit.
The Australian Dollar (AUD), the Canadian Dollar (CAD), the New Zealand Dollar (NZD) and minor FX like the Ruble (RUB) and the South African Rand (ZAR), all tend to rise in markets that are “risk-on”. This is because the economies of these currencies are heavily reliant on commodity exports for growth, and commodities tend to rise in price during risk-on periods. This is because investors foresee greater demand for raw materials in the future due to heightened economic activity.
The major currencies that tend to rise during periods of “risk-off” are the US Dollar (USD), the Japanese Yen (JPY) and the Swiss Franc (CHF). The US Dollar, because it is the world’s reserve currency, and because in times of crisis investors buy US government debt, which is seen as safe because the largest economy in the world is unlikely to default. The Yen, from increased demand for Japanese government bonds, because a high proportion are held by domestic investors who are unlikely to dump them – even in a crisis. The Swiss Franc, because strict Swiss banking laws offer investors enhanced capital protection.
Forex News
Keep up with the financial markets, know what's happening and what is affecting the markets with our latest market updates. Analyze market movers, trends and build your trading strategies accordingly.


