US Dollar Index Price Forecast: Hovers around 103.50 support close to four-month lows
- The US Dollar Index may test its primary support at the four-month low of 103.34.
- The 14-day RSI hovers around 30, indicating oversold conditions and the potential for an upward correction.
- The immediate resistance appears at the nine-day EMA of 104.15.
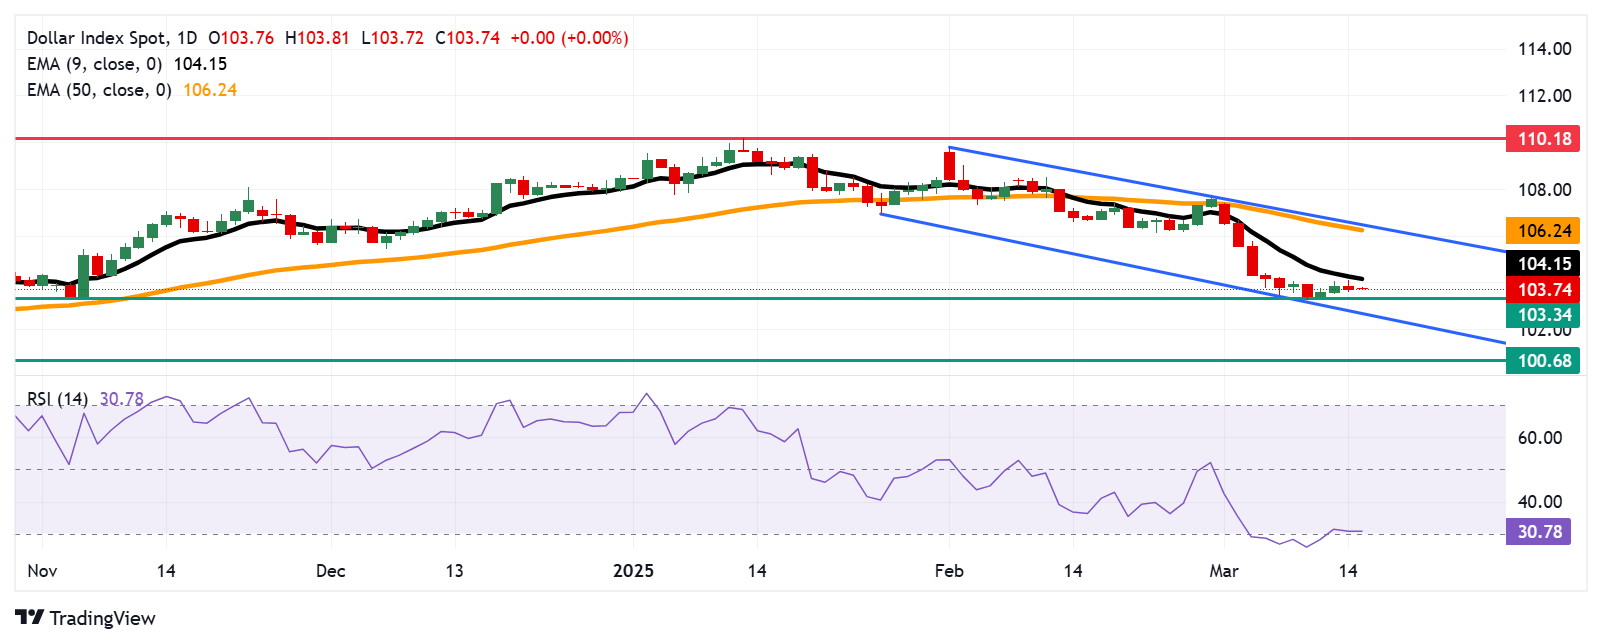
The US Dollar Index (DXY), which tracks the US Dollar's (USD) performance against six major currencies, remains under pressure for the second straight session, hovering around 103.70 during Monday's European trading hours. Technical analysis of the daily chart suggests a continued bearish outlook, as the index trends lower within a descending channel.
The US Dollar Index is trading below the nine- and 50-day Exponential Moving Averages (EMAs), signaling a weakening short- and medium-term trend. However, the 14-day Relative Strength Index (RSI) hovers around the 30 mark, indicating oversold conditions and the possibility of a rebound.
On the downside, the US Dollar Index could test its key support at the four-month low of 103.34, recorded on November 6, followed by the descending channel's lower boundary at 102.70. A decisive break below this level may strengthen the bearish outlook, potentially driving the index toward the five-month low of 100.68.
The DXY faces immediate resistance at the nine-day EMA at 104.15. A breakout above this level could boost short-term momentum, driving the index toward the 50-day EMA at 106.24, with further upside potential toward the descending channel's upper boundary at 106.60.
US Dollar Index: Daily Chart
US Dollar PRICE Today
The table below shows the percentage change of US Dollar (USD) against listed major currencies today. US Dollar was the weakest against the New Zealand Dollar.
| USD | EUR | GBP | JPY | CAD | AUD | NZD | CHF | |
|---|---|---|---|---|---|---|---|---|
| USD | -0.03% | -0.04% | 0.06% | -0.12% | -0.12% | -0.45% | -0.13% | |
| EUR | 0.03% | -0.13% | -0.32% | -0.09% | -0.23% | -0.43% | -0.14% | |
| GBP | 0.04% | 0.13% | 0.13% | -0.18% | -0.11% | -0.32% | -0.08% | |
| JPY | -0.06% | 0.32% | -0.13% | -0.17% | -0.38% | -0.44% | -0.31% | |
| CAD | 0.12% | 0.09% | 0.18% | 0.17% | -0.21% | -0.33% | -0.57% | |
| AUD | 0.12% | 0.23% | 0.11% | 0.38% | 0.21% | -0.18% | 0.10% | |
| NZD | 0.45% | 0.43% | 0.32% | 0.44% | 0.33% | 0.18% | 0.29% | |
| CHF | 0.13% | 0.14% | 0.08% | 0.31% | 0.57% | -0.10% | -0.29% |
The heat map shows percentage changes of major currencies against each other. The base currency is picked from the left column, while the quote currency is picked from the top row. For example, if you pick the US Dollar from the left column and move along the horizontal line to the Japanese Yen, the percentage change displayed in the box will represent USD (base)/JPY (quote).
Forex News
Keep up with the financial markets, know what's happening and what is affecting the markets with our latest market updates. Analyze market movers, trends and build your trading strategies accordingly.