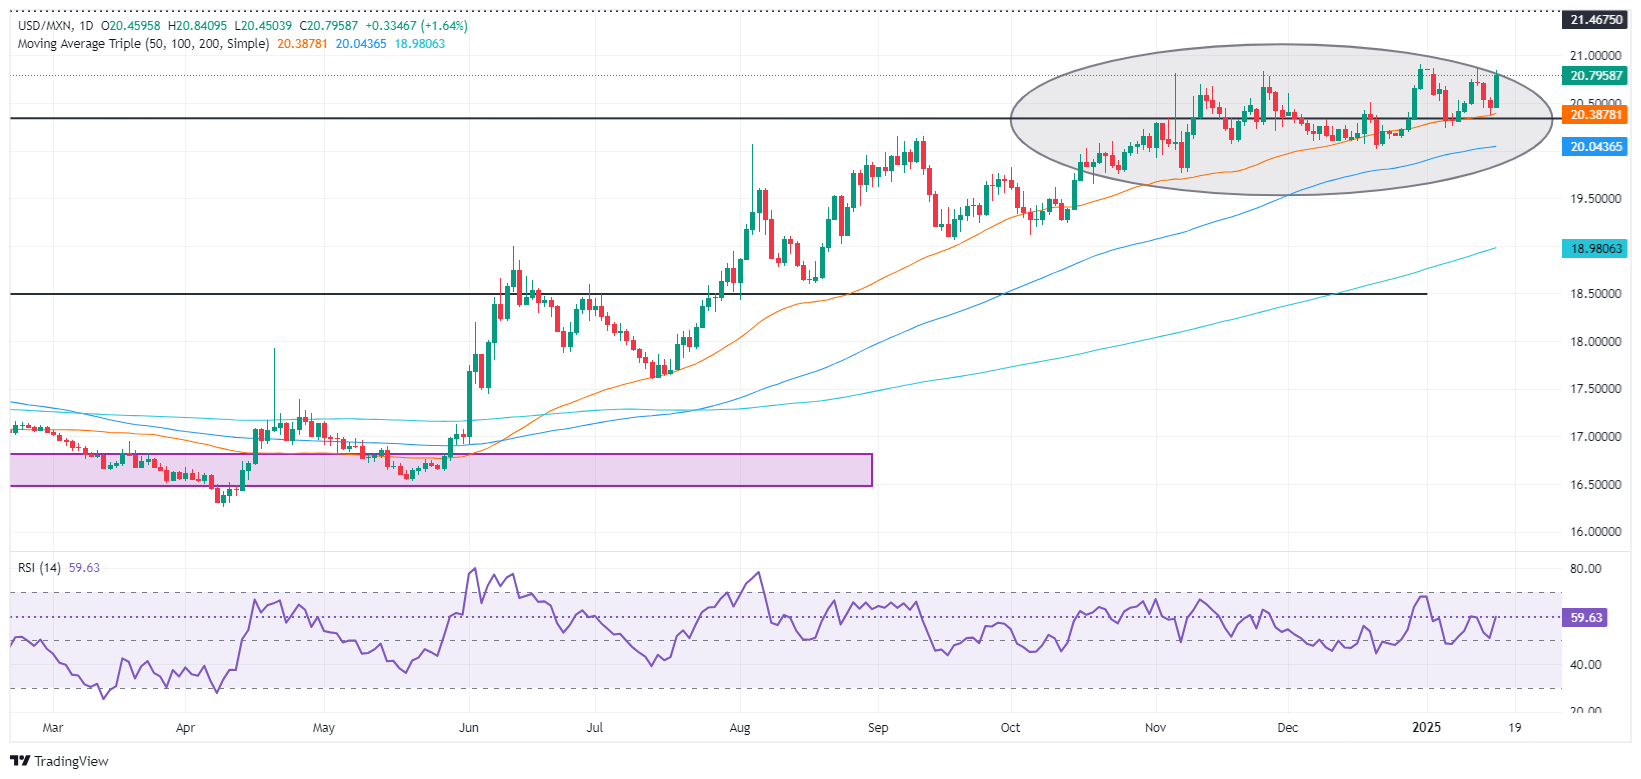
Mexican Peso plunges amid overall US Dollar weakness
Most recent article: Mexican Peso rebounds from yearly low on risk-appetite improvement
- Mexican Peso weakens amid US economic data releases and upcoming political events.
- Mexico's Gross Fixed Investment shows a slight October improvement, still below past highs.
- Fed Governor Waller suggests more aggressive rate cuts may depend on future economic data.
The Mexican Peso (MXN) tumbled to a three-day low against the US Dollar (USD) as traders digested economic data released in the United States (US) and as financial markets prepared for US President-elect Donald Trump’s inauguration next week. The USD/MXN trades at 20.80, gaining over 1.30%.
Mexico’s economic docket in the week revealed that Gross Fixed Investment improved in October, coming at 0.1% MoM, up from a contraction of 0.7% in November’s data. Yet the figures reported by the Instituto Nacional de Estadistica Geografia e Informatica (INEGI) remained anemic against double-digit figures revealed in April 2024.
In the US, December Retail Sales revealed by the US Census Bureau remained solid despite missing projections, yet an upward revision to November figures indicates the economy remains healthy.
Meanwhile, Federal Reserve (Fed) Governor Christopher Waller was dovish during an interview with CNBC, stating that the US Central Bank may cut rates sooner and faster than projected if data warrants it.
Ahead this week, Mexico’s economic docket remains absent, with investors awaiting next week's inflation data alongside Retail Sales. In the US, the schedule will feature housing data.
Daily digest market movers: Mexican Peso pressured by speculation on Trump’s policies
- The Mexican Peso will remain pressured the closer we get to Trump’s inauguration, as there are fears that he will impose tariffs and a harsh immigration policy.
- Additionally, the divergence between the Banco de Mexico (Banxico) and the Fed favors further upside in the USD/MXN, as the interest rate differential would reduce by 150 bps.
- According to the latest Citi private economists survey, Banxico is expected to cut rates by 200 basis points in 2025. The Fed projected to cut 50 bps, according to the latest Summary of Economic Projections (SEP).
- US Retail Sales for December rose by 0.4% Month over Month, missing the mark. However, an upward revision of November figures to 0.8% showed the economy remains robust.
- Initial Jobless Claims for the week ending January 10 increased by 217K from 203K the previous week, missing estimates of 210K.
- Money market futures had priced in 40 bps of Fed rate cuts in 2025, according to CME FedWatch Tool data.
USD/MXN technical outlook: Mexican Peso plummets as USD/MXN climbs above 20.80
On Thursday, the exotic pair resumed its uptrend, with traders eyeing the year-to-date (YTD) peak at 20.90. At the time of writing, the USD/MXN faces strong resistance at 20.86, the January 13 high, ahead of the latter. An additional upside is seen, once those levels are cleared, with the next key resistance levels emerging at 21.46, the March 8, 2022 peak, followed by 21.50 and the 22.00 psychological level.
On the other hand, if USD/MXN clears the 50-day Simple Moving Average (SMA) at 20.34, this will expose the 100-day SMA at 20.00, followed by the October 18 swing low of 19.64.

Mexican Peso FAQs
The Mexican Peso (MXN) is the most traded currency among its Latin American peers. Its value is broadly determined by the performance of the Mexican economy, the country’s central bank’s policy, the amount of foreign investment in the country and even the levels of remittances sent by Mexicans who live abroad, particularly in the United States. Geopolitical trends can also move MXN: for example, the process of nearshoring – or the decision by some firms to relocate manufacturing capacity and supply chains closer to their home countries – is also seen as a catalyst for the Mexican currency as the country is considered a key manufacturing hub in the American continent. Another catalyst for MXN is Oil prices as Mexico is a key exporter of the commodity.
The main objective of Mexico’s central bank, also known as Banxico, is to maintain inflation at low and stable levels (at or close to its target of 3%, the midpoint in a tolerance band of between 2% and 4%). To this end, the bank sets an appropriate level of interest rates. When inflation is too high, Banxico will attempt to tame it by raising interest rates, making it more expensive for households and businesses to borrow money, thus cooling demand and the overall economy. Higher interest rates are generally positive for the Mexican Peso (MXN) as they lead to higher yields, making the country a more attractive place for investors. On the contrary, lower interest rates tend to weaken MXN.
Macroeconomic data releases are key to assess the state of the economy and can have an impact on the Mexican Peso (MXN) valuation. A strong Mexican economy, based on high economic growth, low unemployment and high confidence is good for MXN. Not only does it attract more foreign investment but it may encourage the Bank of Mexico (Banxico) to increase interest rates, particularly if this strength comes together with elevated inflation. However, if economic data is weak, MXN is likely to depreciate.
As an emerging-market currency, the Mexican Peso (MXN) tends to strive during risk-on periods, or when investors perceive that broader market risks are low and thus are eager to engage with investments that carry a higher risk. Conversely, MXN tends to weaken at times of market turbulence or economic uncertainty as investors tend to sell higher-risk assets and flee to the more-stable safe havens.
Forex News
Keep up with the financial markets, know what's happening and what is affecting the markets with our latest market updates. Analyze market movers, trends and build your trading strategies accordingly.
