EUR/USD refreshes two-year low as traders pare Fed dovish bets
- EUR/USD slumps below 1.0200 as the US Dollar remains firm on expectations that the Fed will cut interest rates only once this year.
- Traders pare Fed dovish bets after upbeat US NFP data for December.
- ECB’s Lane supports more rate cuts to ensure the Eurozone doesn’t grow too slowly.
EUR/USD slides to a fresh over two-year low to near 1.0170 at the start of the week. The major currency pair weakens as the US Dollar (USD) performs strongly amid soaring bond yields. The US Dollar Index (DXY), which tracks the Greenback’s value against six major currencies, jumps above 110.00, the highest level seen in over two years. 10-year US Treasury yields jump to a fresh yearly high at around 4.80%
US bond yields rallied amid growing speculation that the current policy-easing cycle by the Federal Reserve (Fed) has paused for now. Fed dovish bets squeezed after the release of the upbeat United States (US) Nonfarm Payrolls (NFP) data for December on Friday. Fresh payrolls were surprisingly higher than November’s reading, and the Unemployment Rate decelerated.
"Given a resilient labor market, we now think the Fed cutting cycle is over," Bank of America (BofA) said in a note. The BofA added that the economic activity is “robust,” and sees “little reason for additional easing”. The bank also noted that risks to inflation have skewed to the upside.
According to the CME FedWatch tool, the Fed is unlikely to cut interest rates before its June policy meeting.
This week, investors will pay close attention to the US Producer Price Index (PPI) and the Consumer Price Index (CPI) data for December, which will be published on Tuesday and Wednesday, respectively.
US Dollar PRICE Today
The table below shows the percentage change of US Dollar (USD) against listed major currencies today. US Dollar was the strongest against the British Pound.
| USD | EUR | GBP | JPY | CAD | AUD | NZD | CHF | |
|---|---|---|---|---|---|---|---|---|
| USD | 0.32% | 0.58% | -0.41% | -0.09% | -0.02% | 0.14% | 0.08% | |
| EUR | -0.32% | 0.24% | -0.66% | -0.35% | -0.20% | -0.16% | -0.16% | |
| GBP | -0.58% | -0.24% | -0.92% | -0.59% | -0.44% | -0.36% | -0.39% | |
| JPY | 0.41% | 0.66% | 0.92% | 0.31% | 0.31% | 0.40% | 0.49% | |
| CAD | 0.09% | 0.35% | 0.59% | -0.31% | 0.03% | 0.22% | 0.23% | |
| AUD | 0.02% | 0.20% | 0.44% | -0.31% | -0.03% | 0.04% | 0.03% | |
| NZD | -0.14% | 0.16% | 0.36% | -0.40% | -0.22% | -0.04% | -0.03% | |
| CHF | -0.08% | 0.16% | 0.39% | -0.49% | -0.23% | -0.03% | 0.03% |
The heat map shows percentage changes of major currencies against each other. The base currency is picked from the left column, while the quote currency is picked from the top row. For example, if you pick the US Dollar from the left column and move along the horizontal line to the Japanese Yen, the percentage change displayed in the box will represent USD (base)/JPY (quote).
Daily digest market movers: EUR/USD declines as ECB Lane, Vujčić support more interest rate cuts
- EUR/USD faces selling pressure due to dismal market sentiment, which has weighed heavily on the Euro (EUR). Investors have become risk-averse amid uncertainty that protectionist policies under US President-elect Donald Trump's administration will lead to a global trade war, diminishing the appeal of risk-perceived assets.
- Donald Trump is considering a declaration of national economic emergency that will allow him to construct a new tariff plan on legal grounds. In the election campaign, Trump threatened that the European Union (EU) would have to “pay a big price” for not buying “enough American exports”.
- Domestically, firm expectations of more policy-easing from the European Central Bank (ECB) keep the Euro on the back foot. In a "policy dialogue" at the Asian Financial Forum (AFF) 2025 on Monday, ECB Chief Economist Philip Lane said that more interest rate cuts from the central bank are likely as they need to make sure that the economy does not grow “too slowly”. Lane added that the ECB needs to choose the middle path of being “neither too aggressive nor too cautious” this year.
- Also, ECB policymaker and Deputy Governor of the Croatian National Bank Boris Vujčić has commented that he is comfortable with market speculation of more interest rate cuts. However, Boris pushed back expectations of an "acceleration in the current policy-easing pace". He advocated "gradual interest rate cuts amid uncertainty".
Technical Analysis: EUR/USD tests region below 1.0200
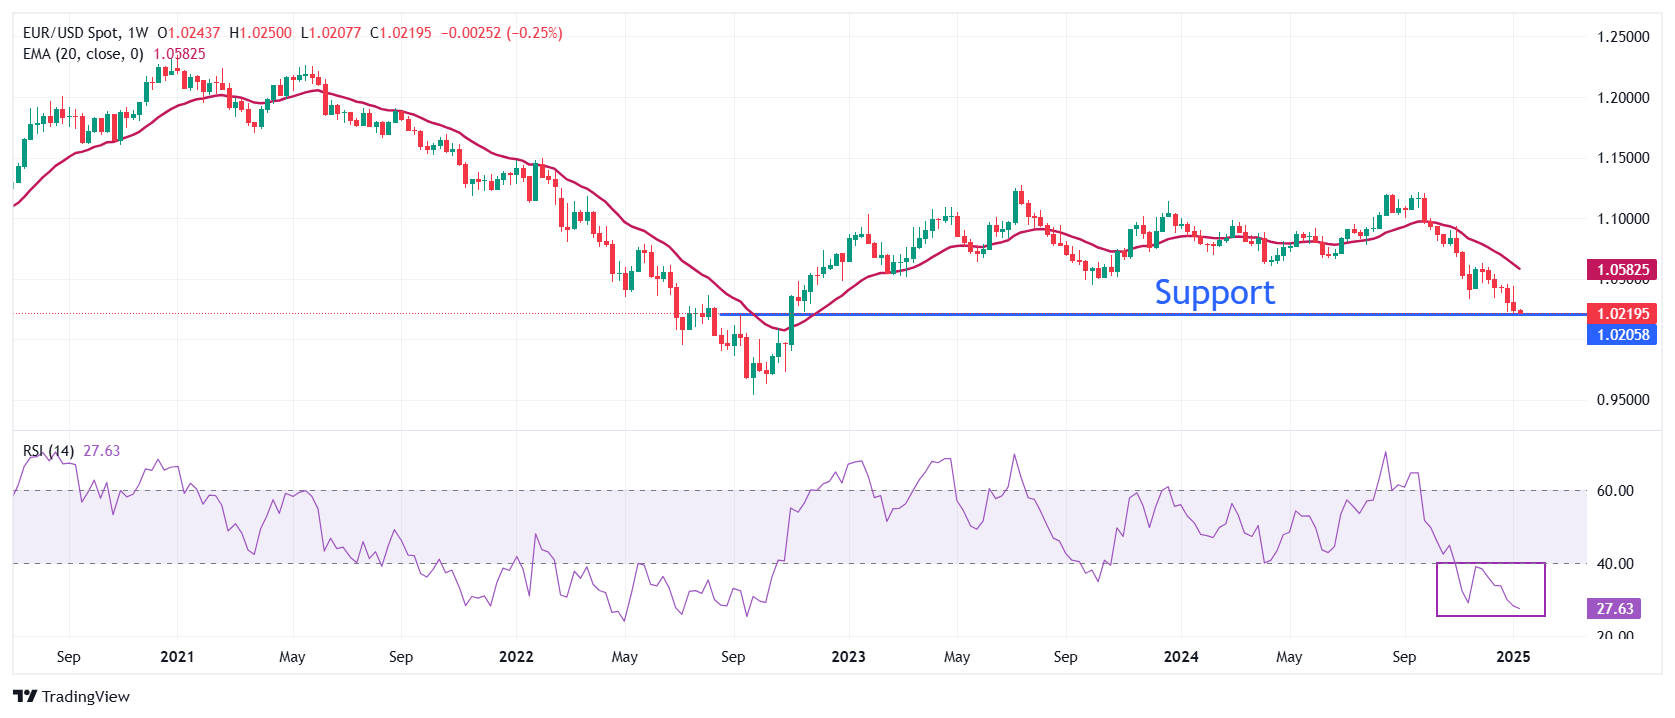
EUR/USD declines to near the key support on the weekly chart, plotted from the September 2022 high of 1.0200. The outlook for the major currency pair is broadly bearish as the 20-week Exponential Moving Average (EMA) at 1.0580 is declining.
The 14-week Relative Strength Index (RSI) slides below 30.00, indicating a strong downside momentum.
Looking down, the pair could find support near the round level of 1.0100. Conversely, the January 6 high of 1.0437 will be the key barrier for the Euro bulls.
Forex News
Keep up with the financial markets, know what's happening and what is affecting the markets with our latest market updates. Analyze market movers, trends and build your trading strategies accordingly.
