Gold price retains intraday positive bias; lacks follow-through ahead of US PPI
- Gold price regains positive traction amid a modest pullback in the US bond yields.
- Hawkish Fed expectations favor the USD bulls and should cap the precious metal.
- The risk-on impulse might further contribute to keeping a lid on the XAU/USD pair.
Gold price (XAU/USD) struggles to capitalize on its modest intraday move up and trades around the $2,669-$2,670 area through the first half of the European session on Tuesday, still up over 0.25% for the day. The US Treasury bond yields retreat from over a one-year peak in reaction to reports that US President-elect Donald Trump's top economic advisers are mulling a slow ramp-up in tariffs to prevent a sudden spike in inflation. This, in turn, drags the US Dollar (USD) away from a two-year peak and lends some support to the precious metal.
That said, a combination of factors keeps a lid on the Gold price. Easing fears about disruptive trade tariffs under Trump 2.0 boosts investors' confidence. Furthermore, the upbeat US Nonfarm Payrolls (NFP) report released on Friday reinforced bets for a slower pace of interest rate cuts this year. This should act as a tailwind for the US bond yields and the USD, which is holding back traders from placing aggressive bullish bets around the non-yielding yellow metal. Investors now look to the US Producer Price Index (PPI) for a fresh impetus.
Gold price bulls seem non-committed amid risk-on mood, bets for slower Fed rate cuts
- Bloomberg, citing people familiar with the matter, reported on Monday that President-elect Donald Trump's economic advisers are considering a program to gradually increase tariffs month by month.
- The approach, aimed at boosting negotiating leverage and helping avoid a sudden spike in inflation, triggers a modest pullback in the US Treasury bond yields and revives demand for the Gold price.
- The sizzling US job report cemented expectations the Federal Reserve will proceed with caution while cutting rates this year, which helps the US Dollar to stall Monday's pullback from over a two-year high.
- The Fed's hawkish outlook should also limit the benchmark 10-year US Treasury bond yields' corrective slide from a 14-month high and keep a lid on any further gains for the non-yielding yellow metal.
- US President-elect Donald Trump has repeatedly promised to end the conflict in Ukraine and said that he will meet Russian President Vladimir Putin “very quickly” after he takes office next week.
- The US indicated that a ceasefire deal is on the brink of success while Hamas said talks are progressing well. Two Israeli officials said that Hamas will release 33 hostages in the first phase of the ceasefire agreement.
- Investors now look forward to key inflation prints – starting with the Producer Price Index later today, followed by the US consumer inflation figures on Wednesday – for some meaningful impetus.
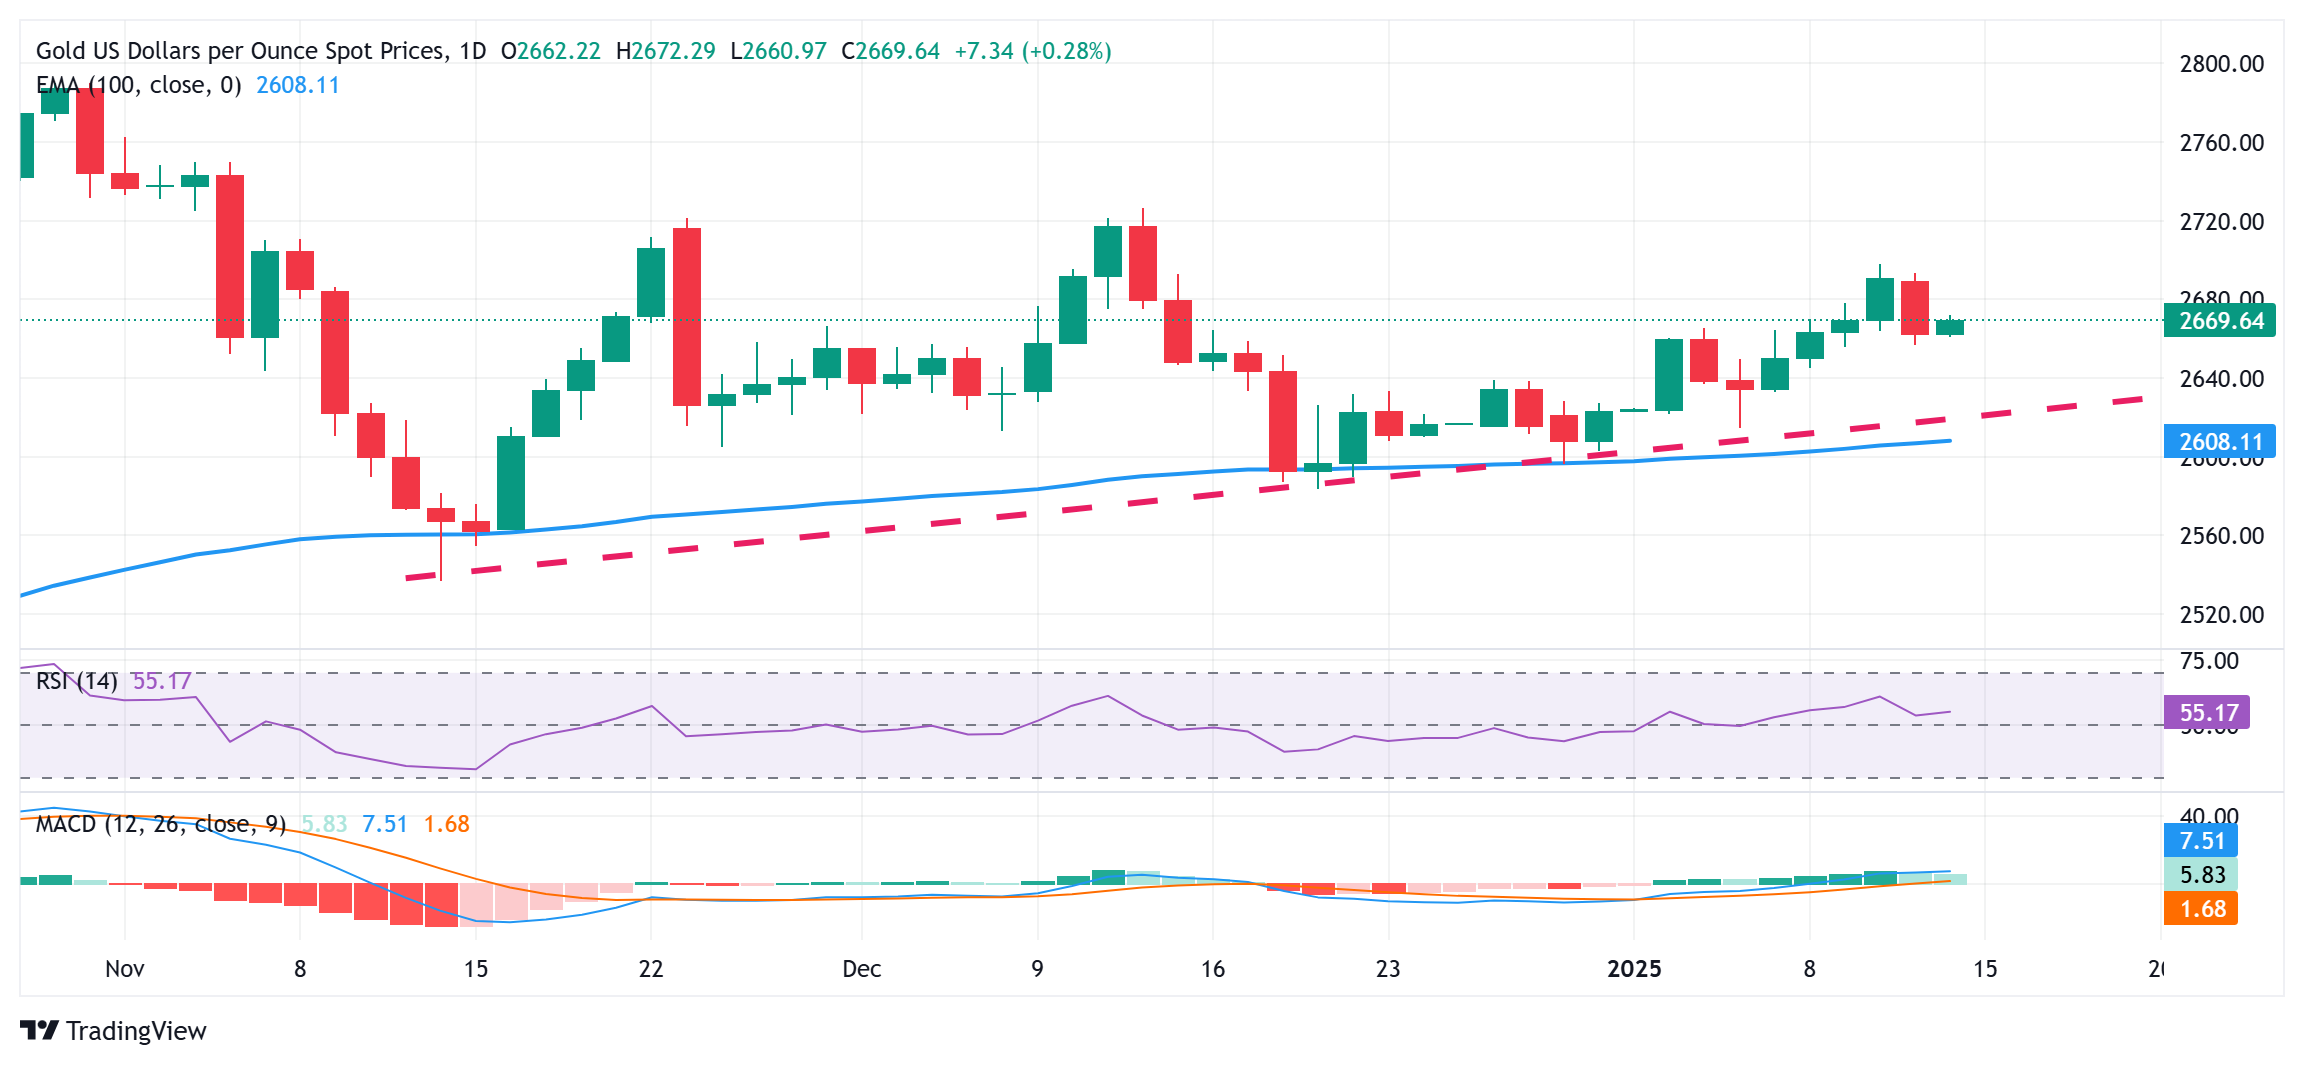
Gold price struggles to capitalize on intraday move-up, remains below $2,700 pivotal hurdle

From a technical perspective, any subsequent strength beyond the $2,676-2,677 area is likely to confront some resistance near the $2,690 zone ahead of the $2,700 mark. Some follow-through buying beyond the latter will set the stage for an extension of over a three-week-old uptrend and lift the Gold price to the $2,716-2,717 hurdle en route to the December monthly swing high, around the $2,726 region.
On the flip side, the $2,657-2,656 area, Monday's low, might continue to protect the immediate downside. A convincing break below, however, could make the Gold price vulnerable to accelerate the downfall towards the $2,635 region. The downward trajectory could extend further towards the $2,610 confluence, comprising the 100-day Exponential Moving Average (SMA) and a multi-week-old ascending trend line.
Economic Indicator
Producer Price Index (YoY)
The Producer Price Index released by the Bureau of Labor statistics, Department of Labor measures the average changes in prices in primary markets of the US by producers of commodities in all states of processing. Changes in the PPI are widely followed as an indicator of commodity inflation. Generally speaking, a high reading is seen as positive (or bullish) for the USD, whereas a low reading is seen as negative (or bearish).
Read more.Next release: Tue Jan 14, 2025 13:30
Frequency: Monthly
Consensus: 3.4%
Previous: 3%
Source: US Bureau of Labor Statistics
Forex News
Keep up with the financial markets, know what's happening and what is affecting the markets with our latest market updates. Analyze market movers, trends and build your trading strategies accordingly.
