Gold price recovers a part of intraday losses, down a little around $2,760 area
- Gold price kicks off the new week on a weaker note amid a modest USD recovery.
- Fed rate cut bets and sliding US bond yields cap the USD gains and lend support.
- Renewed trade war fears also contribute to limiting losses for the XAU/USD pair.
Gold price (XAU/USD) recovers a major part of its intraday losses and trades with a mild negative bias, around the $2,760 area during the first half of the European session on Monday. US President Donald Trump's decision to impose tariffs on all imports from Colombia revives trade war fears and triggers a fresh wave of the global risk-aversion trade. Apart from this, sliding US Treasury bond yields, amid bets that the Federal Reserve (Fed) will cut interest rates twice this year, lends additional support to the non-yielding yellow metal.
That said, a goodish US Dollar (USD) recovery from over a one-month low touched on Friday might hold back traders from placing fresh bullish bets around the Gold price. Nevertheless, the aforementioned fundamental backdrop seems tilted firmly in favor of the XAU/USD bulls and suggests that the path of least resistance for the bullion remains to the upside. Hence, a move towards challenging the all-time peak, around the $2,790 area, looks like a distinct possibility. Traders now look to the US economic data for a fresh impetus.
Gold price attracts some dip-buyers amid risk-off impulse, Fed rate cut bets
- The US Dollar, which tracks the Greenback against a basket of currencies, climbs nearly 0.25% amid reviving concerns about US President Donald Trump's trade policies and prompts some selling around the Gold price on Monday.
- Trump ordered his Administration to introduce emergency 25% tariffs on all goods coming from Colombia after the Colombian government refused to allow two US military planes carrying deported migrants to land in the country.
- Trump warned that the tariffs will increase to 50% by next week if the Latin American country refuses to comply with his immigration policies, fueling trade war fears and tempering investors' appetite for riskier assets.
- Furthermore, the Wall Street Journal (WSJ) reported that momentum is growing among Trump’s advisers to place 25% tariffs on Mexico and Canada as soon as February 1, without waiting for negotiations or talks.
- In the latest development, the White House confirmed on Monday that Colombia has agreed to all of Trump’s terms, including unrestricted acceptance of all illegal aliens from Colombia returned from the US.
- Meanwhile, Trump said last Thursday that he will demand that interest rates drop immediately, lifting bets that the Federal Reserve would lower borrowing costs further in 2025 and dragging the US Treasury bond yields lower.
- This could act as a headwind for the USD and help limit the downside for the XAU/USD, warranting some caution before confirming that the recent positive move witnessed over the past month or so has run out of steam.
- Traders now look to the US economic docket – featuring Durable Goods Orders, the Conference Board's Consumer Confidence Index and the Richmond Manufacturing Index – for some impetus later during the US session.
Gold price seems poised to retest the all-time high, around the $2,790 region
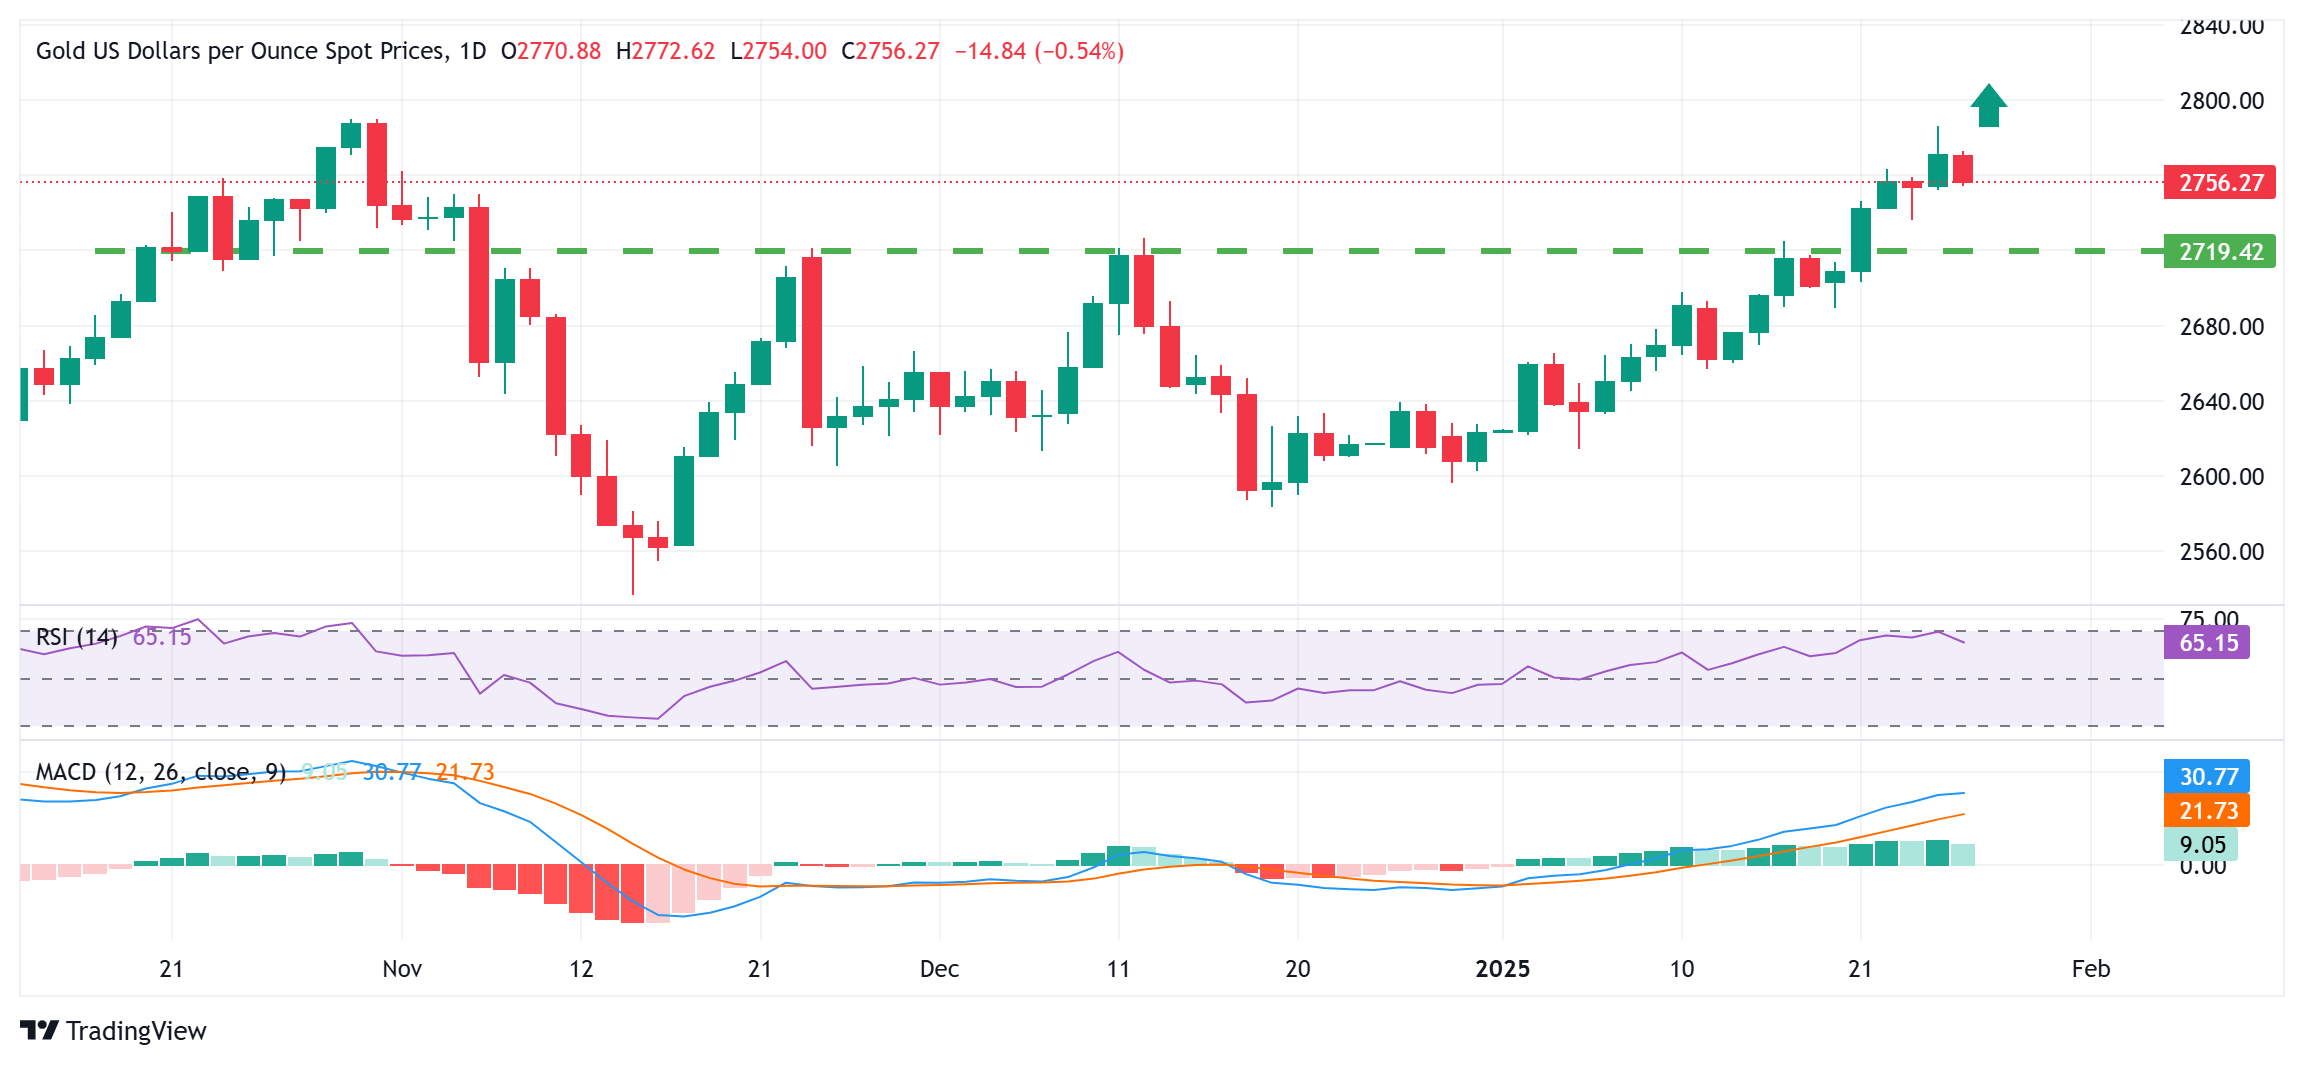
Any subsequent slide below the $2,750-2,748 zone is likely to find support near the $2,736 area ahead of the $2,725-2,720 strong resistance breakpoint. The latter should act as a key pivotal point, which if broken might prompt some technical selling and drag the Gold price below the $2,700 mark, towards the next relevant support near the $2,665-2,662 area.
On the flip side, momentum beyond the $2,772-2,773 immediate hurdle should pave the way for a move back towards the all-time peak, around the $2,790 region touched in October. Some follow-through buying, leading to a strength beyond the $2,800 mark, will be seen as a fresh trigger for bullish traders and pave the way for an extension of the positive move.
US Dollar PRICE Today
The table below shows the percentage change of US Dollar (USD) against listed major currencies today. US Dollar was the strongest against the Australian Dollar.
| USD | EUR | GBP | JPY | CAD | AUD | NZD | CHF | |
|---|---|---|---|---|---|---|---|---|
| USD | 0.16% | 0.20% | -0.59% | 0.09% | 0.42% | 0.34% | -0.33% | |
| EUR | -0.16% | 0.11% | -0.62% | 0.07% | 0.26% | 0.31% | -0.39% | |
| GBP | -0.20% | -0.11% | -1.04% | -0.03% | 0.15% | 0.21% | -0.50% | |
| JPY | 0.59% | 0.62% | 1.04% | 0.73% | 1.19% | 1.18% | 0.40% | |
| CAD | -0.09% | -0.07% | 0.03% | -0.73% | 0.13% | 0.25% | -0.46% | |
| AUD | -0.42% | -0.26% | -0.15% | -1.19% | -0.13% | 0.08% | -0.60% | |
| NZD | -0.34% | -0.31% | -0.21% | -1.18% | -0.25% | -0.08% | -0.92% | |
| CHF | 0.33% | 0.39% | 0.50% | -0.40% | 0.46% | 0.60% | 0.92% |
The heat map shows percentage changes of major currencies against each other. The base currency is picked from the left column, while the quote currency is picked from the top row. For example, if you pick the US Dollar from the left column and move along the horizontal line to the Japanese Yen, the percentage change displayed in the box will represent USD (base)/JPY (quote).
Forex News
Keep up with the financial markets, know what's happening and what is affecting the markets with our latest market updates. Analyze market movers, trends and build your trading strategies accordingly.