GBP/USD keeps pushing against 1.2430 support weighed by weak UK employment data
- The Pound drops on weak UK employment data, to retest support area at 1.2430.
- UK Unemployment rate increased to 4.2% in the three months to February against expectations of a 4% reading.
- Investors’ focus is on Wednesday’s UK CPI data for more clues about the BoE’s monetary policy outlook.
The Sterling has resumed its broader bearish trend during Tuesday’s London trading session. The uninspiring UK employment figures have endorsed the theory that the BoE might start cutting rates ahead of schedule, which has punished the GBP.
The Claimant count range increased below expectations but wage growth eased to 6% YoY in the three months before February, from from 6.1% in the previous period. But above all, the unemployment rate increased to 4.2% disappointing the market that had forecasted a 4% rate, unchanged from the previous month.
The US Dollar maintains its bullish trend intact, fuelled by higher US Treasury yields. The 10-year benchmark yield is trading at year-to-date highs near 4.70%. The 2-year yield the most closely related to interest rate expectations remains pinned to the key 5% level.
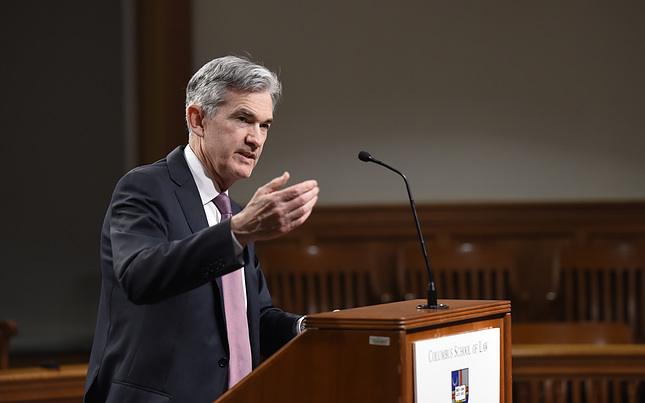
Later on Tuesday BoE Governor Bailey is expected to meet the press although the highlight of the week in the UK will be Wednesday’s CPI data, which is expected to have cooled significantly. Also on Tuesday, Fed Governor, Jerome Powell is expected to participate in a panel discussion in Washington. His comments about monetary policy might have some impact on US Dollar crosses.
GBP/USD Price Analysis: Technical outlook
Bears have pushed the pair back to the bottom of the monthly descending channel, at 1.2430, which is being tested at the moment. Last Friday’s low is right below there, at 1.2430. A clear break of that support area clears the path towards 1.2370. Further down there is no support until 1.2220.
On the upside 1.2505 level should be cleared to advance towards 1.2565, where an unmitigated order block may provide a fresh boost for bears.
Forex News
Keep up with the financial markets, know what's happening and what is affecting the markets with our latest market updates. Analyze market movers, trends and build your trading strategies accordingly.